Content SEO for product companies: Step 3. How to forecast the traffic you will get (and when)

You’ve collected all the keywords for your future content hub articles. Time to evaluate how many potential visitors will bring each of them and when it will happen.
Spoiler: Remember each keyword has Volume? Depending on Keyword Difficulty in 4 months you’ll get 30%, 10% or 0% of this number.
Intrigued? Let’s dive into details 👇
How to define how much traffic you’ll get?
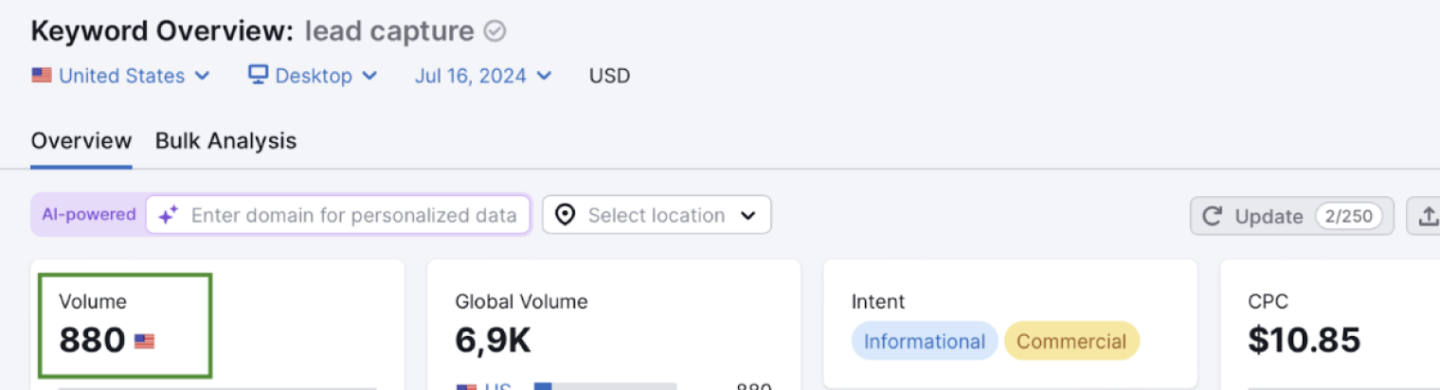
Obviously, the answer lies in the keyword’s Volume.
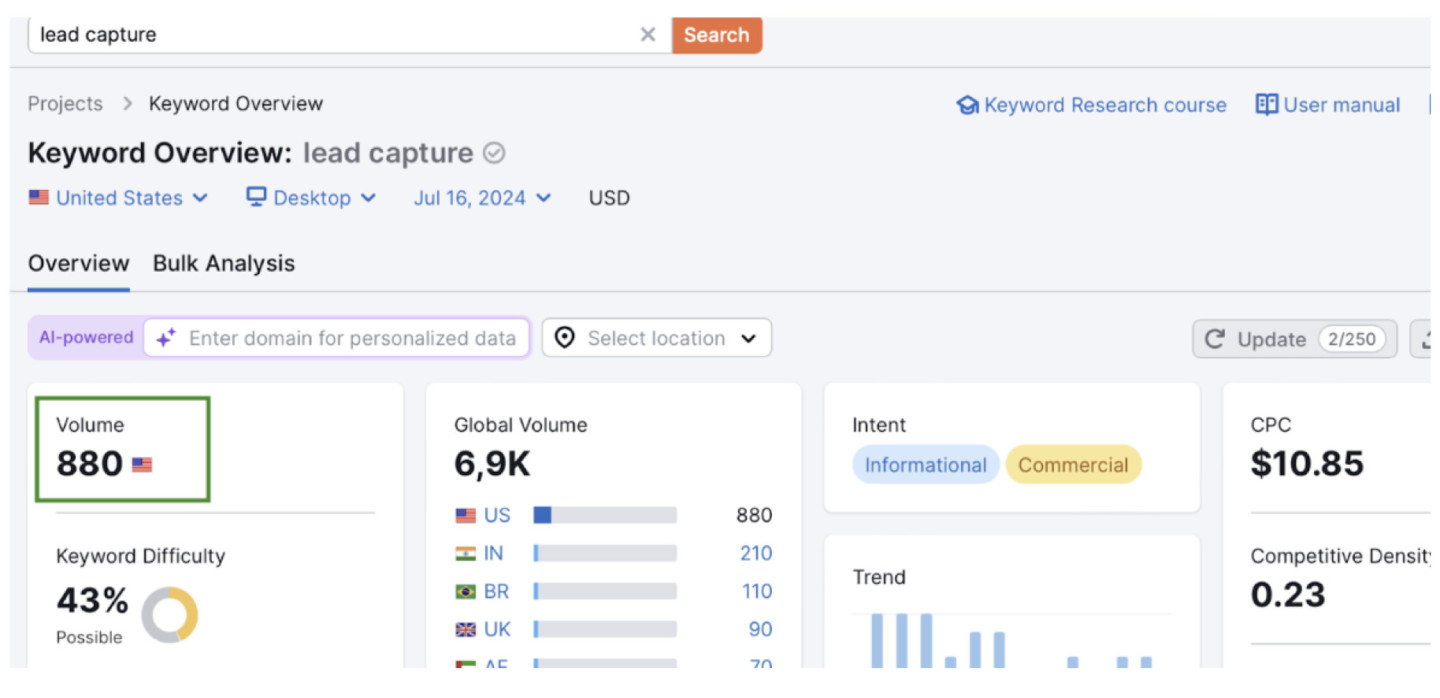
Volume: The maximum number of visits per month for your keyword (data from Semrush, Ahrefs, and similar tools).
Unfortunately, it doesn’t mean you’ll get all that traffic by just adding a keyword to your article. It all depends on the position your post will take in the SERP on the target keyword. The higher it is, the better traffic you’ll get.
The last one forms based on the quality of your content, domain authority rate, keyword difficulty, and a number of backlinks your article will have, and number of Google ads in SERP.
BUT because of the last element (Google ads), even the 1st position won’t bring you the maximum number of visits you see in the keyword overview.
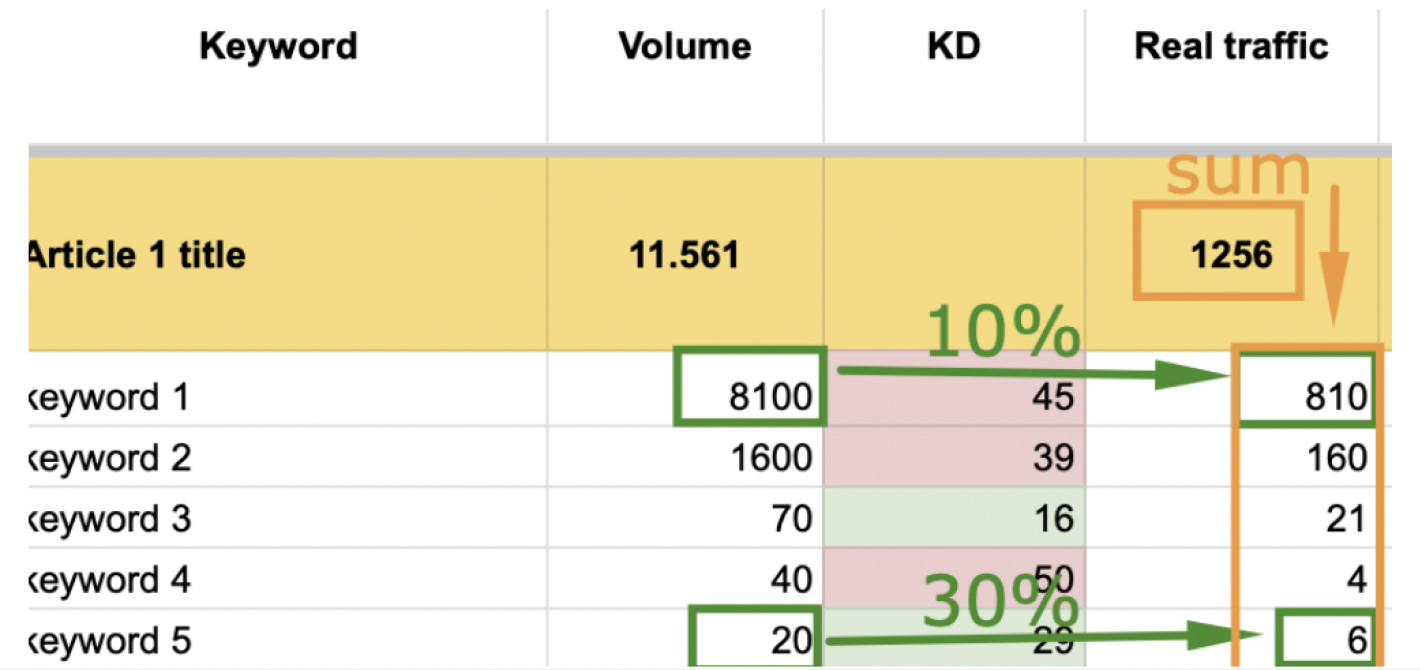
From my experience, websites with up to 40 domain authority that target keywords with KD less than 30 will take place in top 10 Google results and get 30% of the keyword Volume. Those who target keywords with KD more 30-50 will take place in top 100 Google results and get 10% of the keyword Volume. KD over 50 won’t bring you any positions or traffic.
Now apply this formula to each keyword for each article of your content hub and get the real number of visits you’ll get.
Sure thing, it changes from month to month. Let’s say the first articles you’ll write targeting keywords with KD up to 30 will be in top 10-20 results. But when you’ll write 50% of your content hub, they will grow to top 10.
When will you get the planned traffic?
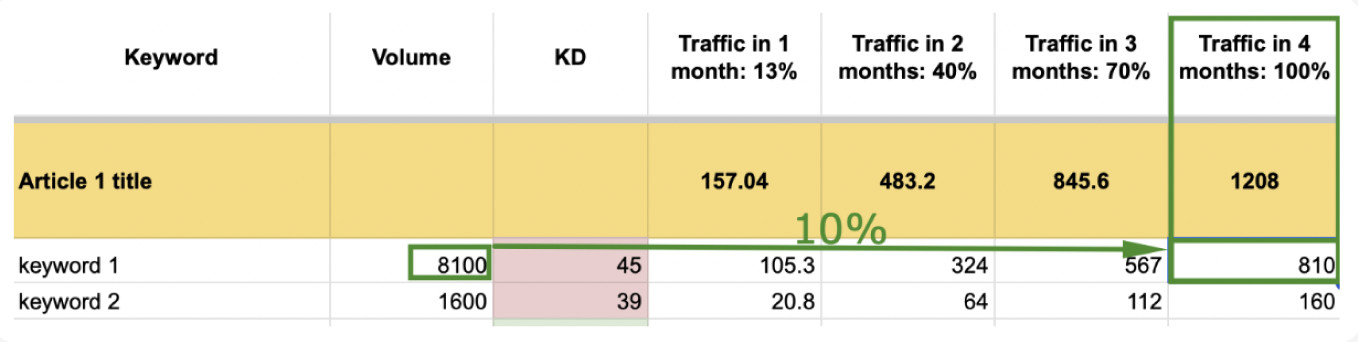
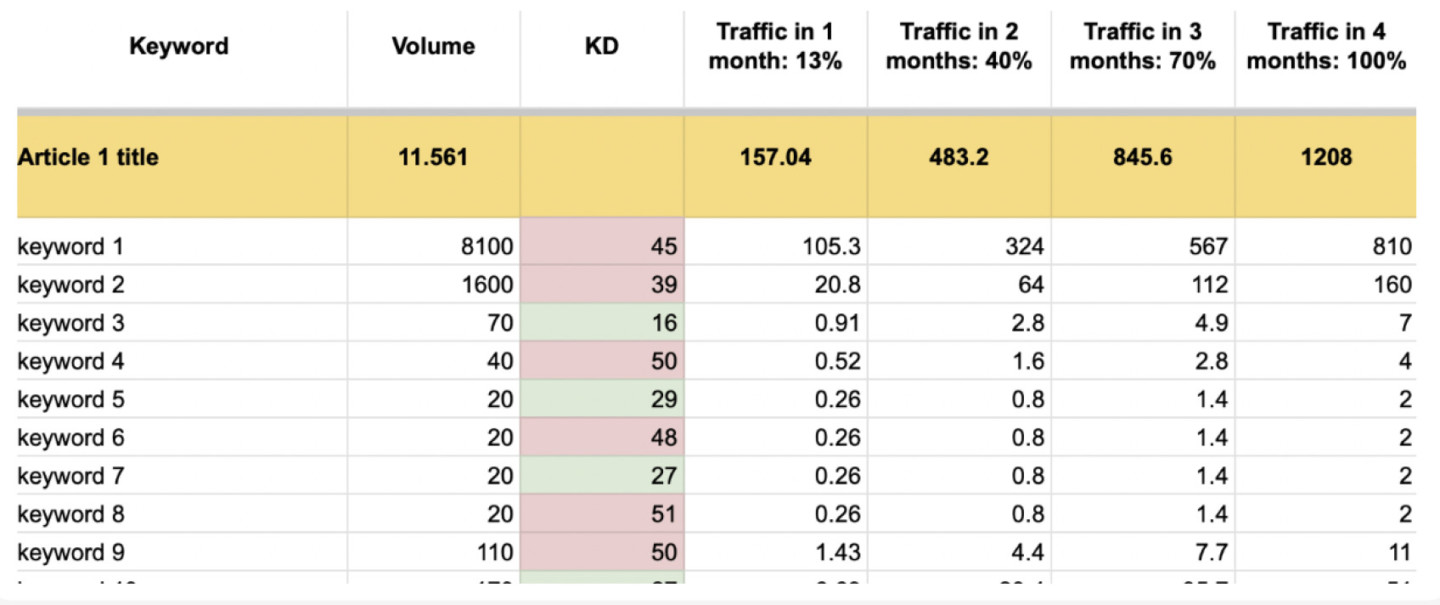
In four months (proved by Dashly experiments with 4 content hubs.) Here is how it works: From the previous step you got the real maximum number of visits your article will get. For example, 1256 visits. This is how it will grow after an article publication:
1st month — 13%
2nd month — 40%
3rd month- 70%
4th month — 100%
Time to practise now ➡️
Go to the Google Spreadsheet with all these formulas applied and add go data following the instructions.
🔗 Your template of the forecast for the traffic of your content hub
Make a copy of this spreadsheet.
1. Go to the “Hub 1 Key Assessment” tab and look at row 7. There you will see the fixed column headers of the table.
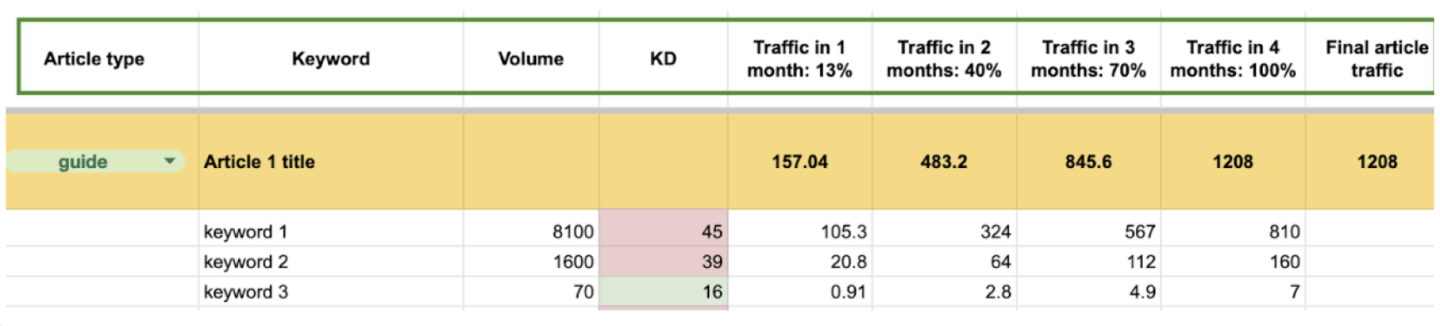
Article Type: In this column, next to each article title, you should indicate its type (guide — the first article of the hub, list of tools/competitors, best practices, etc.)
Keyword: This is the column for your article’s keywords. Volume: The maximum number of visits per month for your keyword (data from Semrush, Ahrefs, and similar tools.)
KD (Keyword Difficulty): The competitiveness of the keyword, indicating how difficult it is to rank for. The lower it is, the better.
Traffic after ½/¾ months: The percentage of traffic growth for your article based on the keyword. (Typically, an article settles in the rankings after 4 months.)
Actual Article Traffic: This is the real traffic you will receive when your article’s keywords achieve their positions. Usually, this is either 30% or 10% of the keyword’s volume.
2. The article titles of the hub are highlighted in orange (there are 4 in the template, but you may have more). Go to the first article (cell B8) and enter its title and type.
3. Under the title, insert all the keywords that you have assigned to the cluster for this article.
4. Next to the keywords, in columns C and D, indicate the Volume and Keyword Difficulty for your keywords. The table contains formulas for traffic calculation, which will automatically pull data into the other columns.
5. In the KD column, mark all numbers above 30 in red and those below 30 in green. This will make it easier for you to adjust the formulas in the “after 4 months” column.
If you have more keywords than the template allows, add additional rows before inserting the keywords. Also, you need to copy and paste the traffic calculation formulas into the new rows.
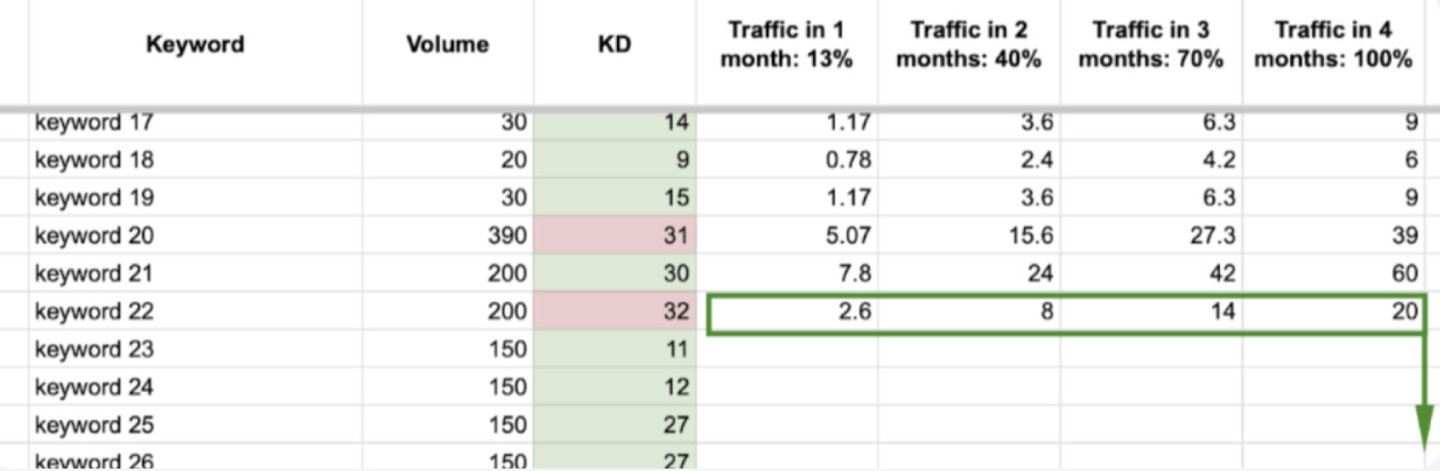
For this select the last filled traffic cells (click on them and check if they contain formulas). Then a dot in the corner will appear. Hold it and drag it down to the end of the keys list.
6. In the “in 4 months” column, each cell opposite the keywords has its own formula (determining how much traffic the article will ultimately receive depending on the KD of the keyword:
- if the KD is less than 30, you will receive 30% of the traffic from the maximum volume of the keyword;
- if it is more than 30, you will receive 10% of the traffic).
Your task is to adjust the formula accordingly.
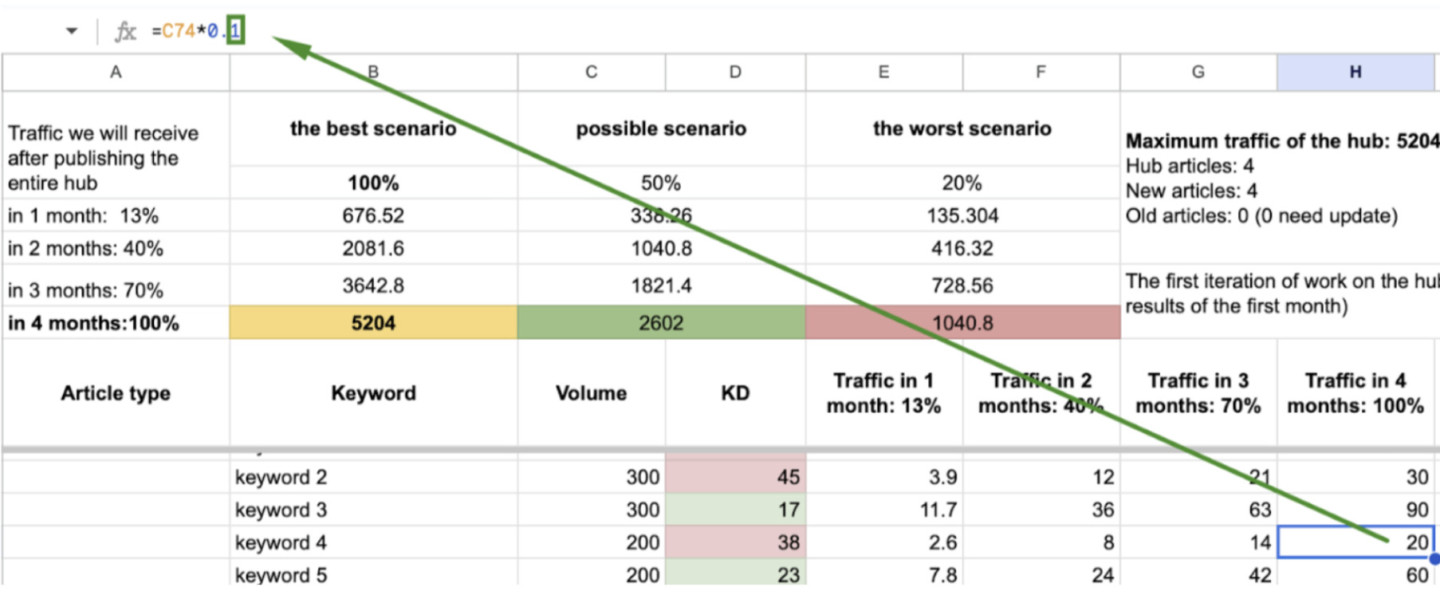
If KD is above 30, the formula should use 0.1. If KD is below 30, adjust it to 0.3
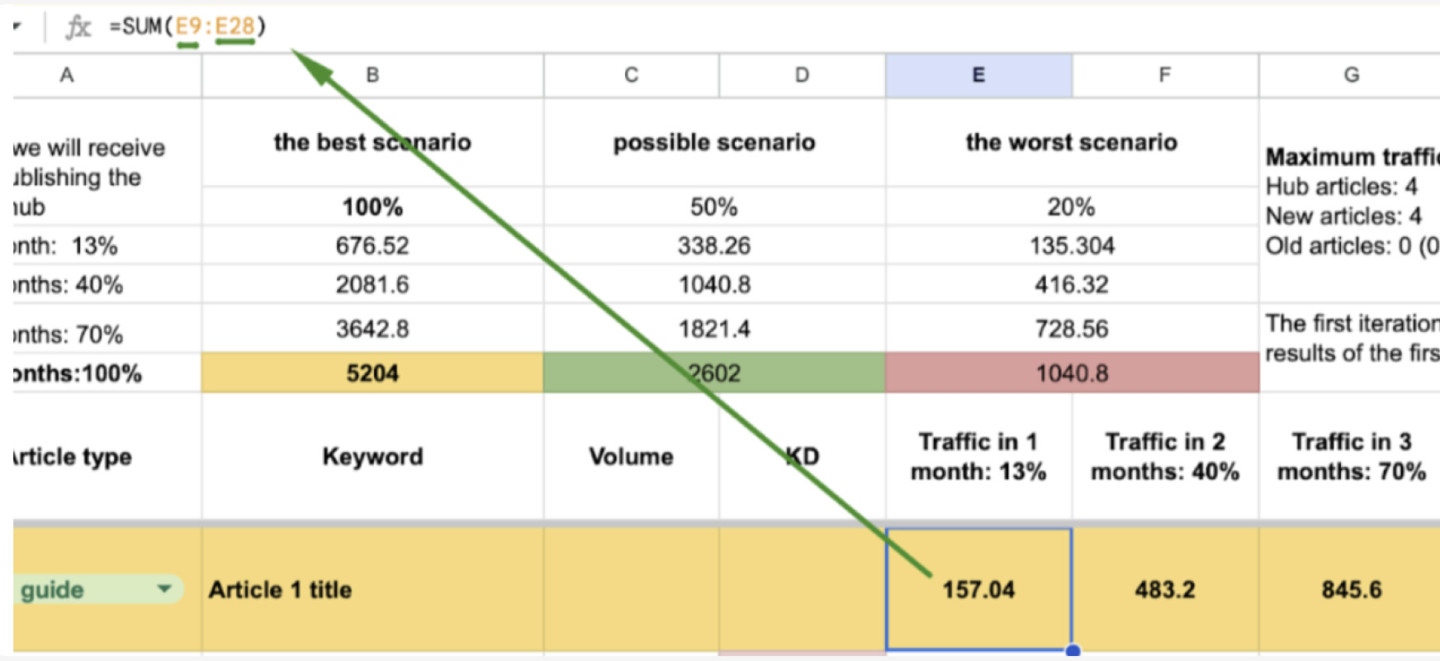
7. Now, let’s return to the article title row. On the right, the numbers on the yellow background represent the sum of the actual traffic for all the keywords in the article that you will receive in a specific month after publication. Since you may have more keywords than in the template, you need to adjust the formula in each cell.
To do this, click on the cell and set the first part of the formula to the cell number at the intersection of ‘traffic after 1 month 13%’ and the first keyword, and the second part to the column letter ‘traffic after 1 month 13%’ and the row number of the last keyword.
Repeat the same for the traffic columns for the 2nd, 3rd, and 4th months.
8. Duplicate the number from the 4th month’s cell into the yellow row cell under “actual article traffic after positions are established”.
Repeat the same for the other articles in your hub.
9. Now click on the header of column I (on the letter itself). At the bottom, the actual traffic of all the articles in the hub will be summed up.
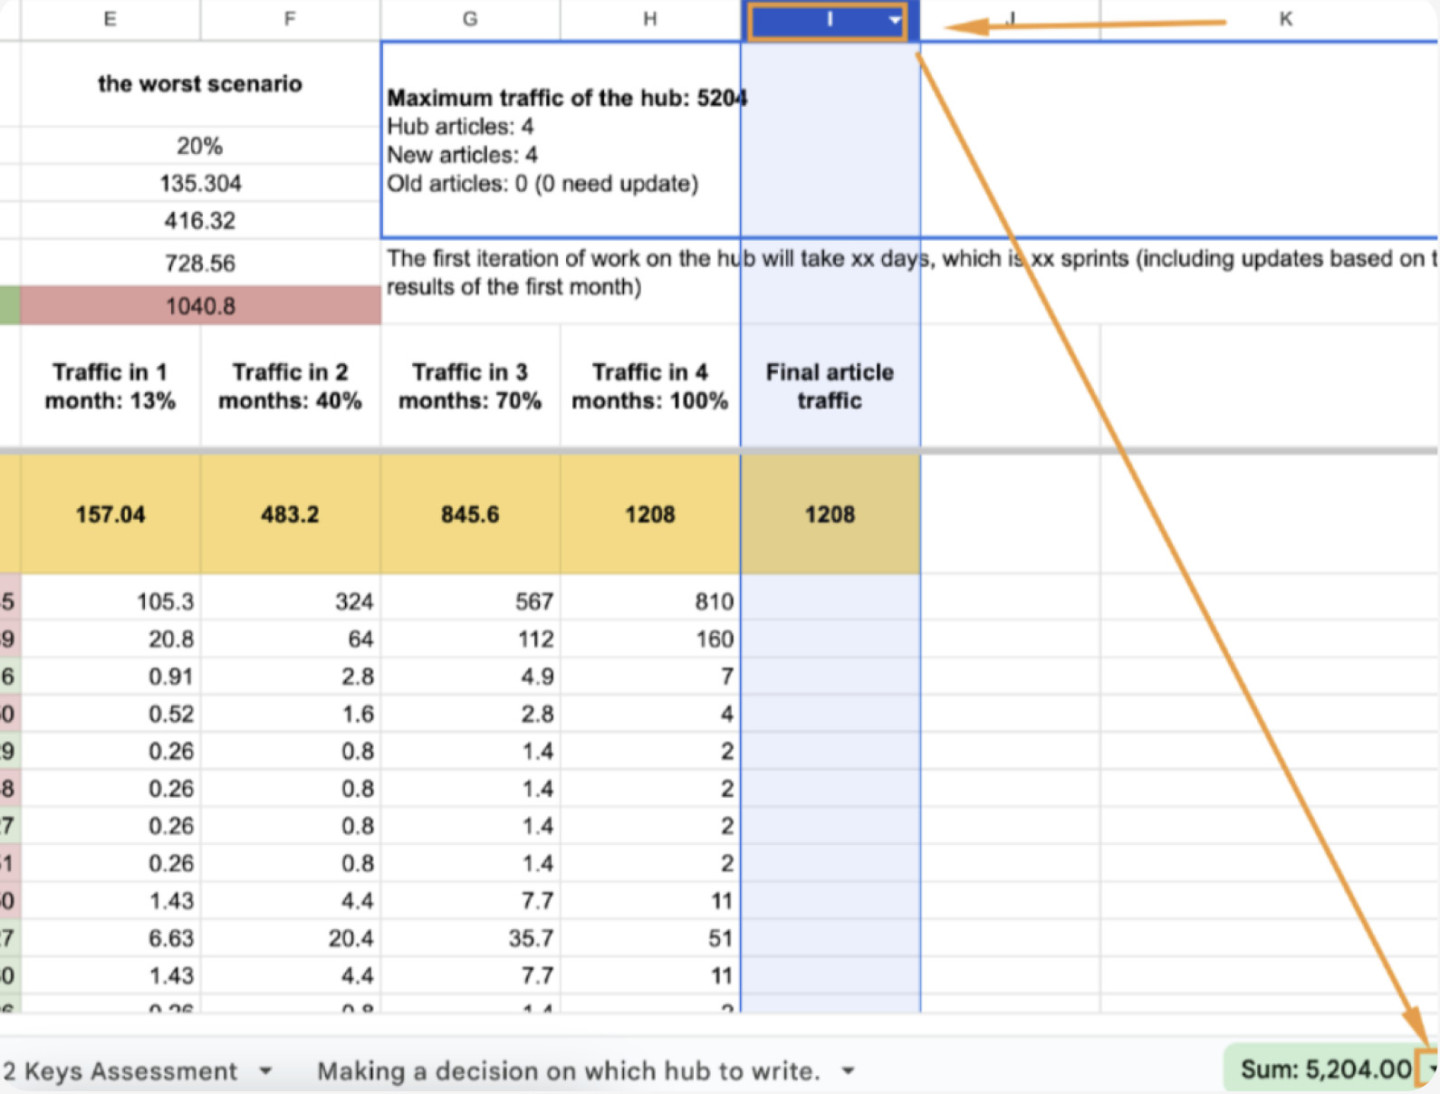
Note that the formula at the bottom might not be SUM but something else. To get the SUM, click on the inverted triangle below my arrow and select SUM from the list.
11. Enter this number in cell B6 and next to the words ‘Maximum hub traffic”.
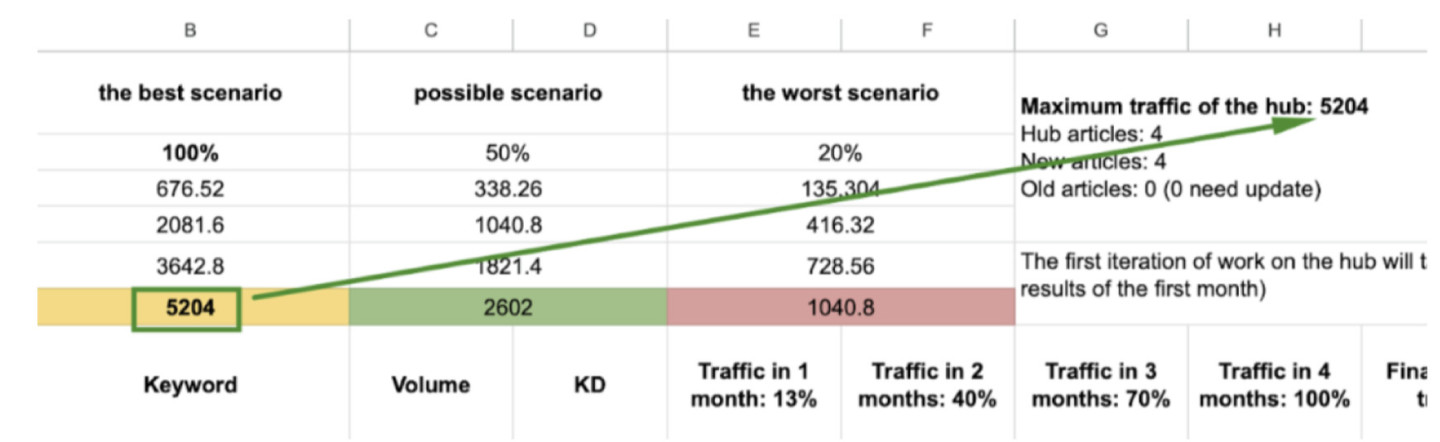
In columns B, C, and D, scenarios for the traffic you might get from the entire hub will be calculated automatically. While we focus on the best scenario, we should also keep the worst scenario in mind.
12. For a better assessment of the hub, you need to indicate the total number of articles to be written and estimate the time required for this.
13. Repeat the same assessment process for the other hubs and their articles in the adjacent cells.
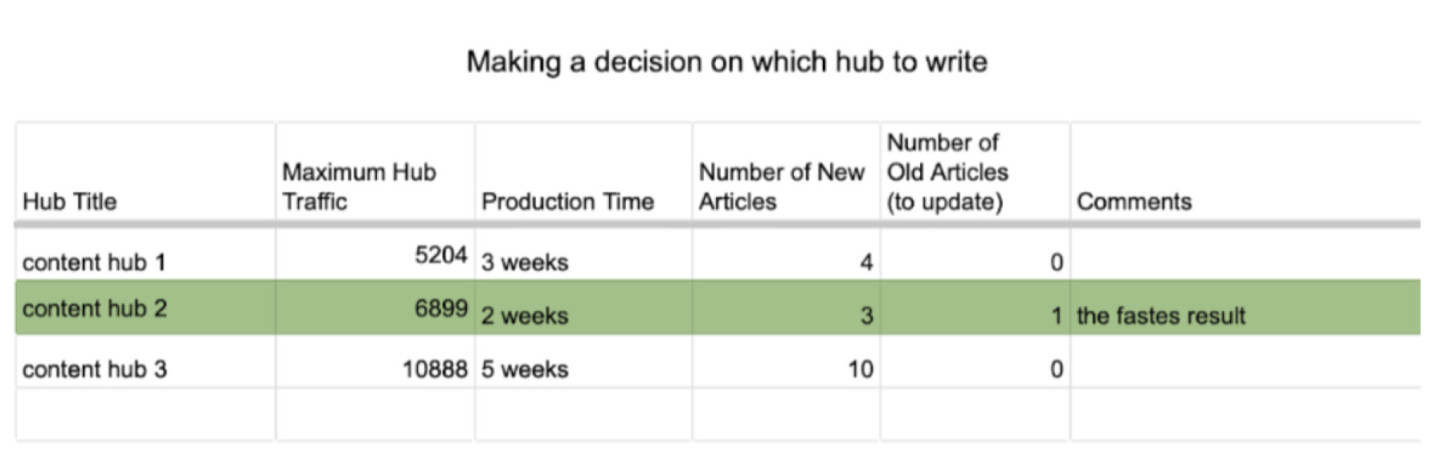
14. Once you have the results for each hub (maximum hub traffic, number of articles, and production time), transfer all this information to the “Decision Making for Hub Writing” tab.
Dive into the keywords again and select the interesting ones. Open each keyword and check the search results to determine which article it should be assigned to. Save all ideas in your spreadsheet.
Go back to the main list of hub keywords for lead capture and repeat the same process with all the keywords that interest you. When you’re done, you can switch to the Related tab and repeat the same steps there.
At this point your traffic forecast is done. Next step — article brief!
Read also: Top 15 Sales Funnel Software Tools Including Free Options


Subscribe to Dashly newsletter
Join the community of 13,000 pros who get expert insights on marketing, support, and sales in a weekly newsletter


