What is a North Star Metric and How Can It Lead to Success

This is an updated version of this article originally posted in 2021
Companies often don’t have a clear vision of their future focus, and initiatives contradict each other. It all drifts companies away from meeting their plans, objectives, or OKR. Today, we’ll elaborate on the North Star metric that will help you choose your path and follow it.
Let’s go!
Don’t have much time to read the entire article? Watch videos!
What is a North Star metric?
The North Star Metric (NSM) is the one that best demonstrates your product’s value. The right North Star can guarantee sustainable long-term growth. It means that the NSM is a key success indicator of the product team.
The NSM should imply three major parameters:
- rate of return to indicate how much a company will earn;
- user value to indicate the product’s value for customers;
- measurability.
Let’s say your major metric is the number of registered users. The more users signed up for your product, the better. This metric is easily measured and demonstrates how much the company is making. But in fact, this metric bears no customer value. It doesn’t say how often customers use your product or whether they like it. This metric doesn’t show whether the new feature release, user onboarding, the updated design performed well, despite its measurability and the company’s rate of return considered.
If you grow the right North Star metric, you’ll grow your company income. You’ll see your product’s value appreciated by users and measure your initiatives right. With this metric, your company will know what improvements need to be implemented and how they will impact future growth.
North star metric vs OKR
A North Star metric is your growth team’s guiding light — the one focus metric that defines long-term success. It’s the heartbeat of your growth model, aligning product, marketing, and strategy around what truly matters.
An OKR (Objectives and Key Results) is a goal-setting framework. It’s how teams break down big goals into smaller, measurable steps. Think of it as the how behind the what.
The Key Difference?
- North Star metric = One ultimate measure of product success. It doesn’t change often.
- OKRs = Short-term objectives tied to specific milestones. They evolve quarterly.
Example?
- Airbnb’s North Star metric: Nights booked. Every product strategy move supports this.
- An OKR for Airbnb? Increase host listings by 20% this quarter.
The North Star metric stays constant. OKRs shift as teams refine their growth strategy.
Want sustainable growth? Set your North Star metric. Then, use OKRs to get there. 🚀
Why do I need the North Star metric?
The North Star metric:
- helps product teams clearly see what needs to be done to improve the NSM values, and what can be painlessly moved to Tasks backlog or simply declined;
- helps see the company progress digitized and accelerate new product initiatives;
- lets you see the exact outcomes of the work you’ve done.
Want to get a free marketing audit?
Let’s schedule a 30-minute call and find out how to:
- Improve your website conversion.
- Grow your ROI/ROMI with proven hypotheses that fit your audience.
- Optimize or launch ad channels without additional budget.
- Decrease SLA workload by saving their time on lead processing.

What North Stars are there?
E-commerce
- weekly first-time buyers;
- daily order value;
- lifetime value.
Digital products
- weekly # of trial accounts with 3+ users;
- the yearly retention rate;
- Monthly Recurring Revenue;
- Monthly Active Users.
Media
- signup count and retention;
- daily active users;
- total reading time;
- total view count.
Can the North Star metric evolve with time?
Yes, but remember that the metric is calculated for a longer term. That’s the strategy. If you change your North Star often, you probably pick the wrong metric and it’ll be hard to achieve tangible results.

Can I have several North Stars?
If you run a complex product or a large company with a complicated ecosystem, one metric may not be enough. However, having 3+ North Stars is bad, too. The idea of a key metric becomes vague and you risk getting your focus blurred.
Examples of north star metrics
Let’s talk real-world North Star metric examples. The companies that get this don’t just grow. They dominate.
⭐ Airbnb North Star Metric: Nights Booked — Turning Empty Spaces Into Experiences
Airbnb didn’t just disrupt hotels; they redefined how we experience travel. But how do you measure something as intangible as “feeling at home anywhere in the world”?
Answer: Nights booked.
This focus metric aligns their growth strategy with their entire growth team. Every service update, pricing experiment, and UX tweak aims at this one thing — getting more people to book more stays.
Why? Because nights booked capture the full cycle of their marketplace:
- Hosts are happy (they’re making money).
- Guests are happy (they’re finding quality stays).
- The site thrives (more data, better recommendations, smarter pricing).
If nights booked go up, Airbnb knows they’re delivering value. Simple. This is why their growth model revolves around making the booking process seamless and intuitive.
⭐ Amazon North Star Metric: Purchases Per User — The Ultimate Conversion Machine
Jeff Bezos didn’t build a bookstore. He built a buying habit. Amazon’s entire product strategy revolves around making it so easy, so fast, and so necessary to buy that you can’t resist.
Their North Star metric? Purchases per user.
Not revenue. Not page views. Not app downloads. Why? Because getting a customer to buy again is where the real magic happens. Every service they launch — Prime, one-click checkout, Alexa shopping —pushes this number higher.
More purchases = better personalization, smarter logistics, and stronger loyalty. The more paying customers Amazon acquires, the more they optimize the growth product to increase repeat purchases.
Once you’ve got customers clicking that “Buy Now” button without thinking? Game over. You win.
⭐ Amplitude North Star Metric: Weekly Learning Users — The Analytics That Powers Analytics
Amplitude is the go-to tool for growth teams obsessed with analytics and experimentation. But if your business is selling product metric insights, how do you measure success?
For them, it’s not about sign-ups. Not even dashboards viewed. It’s Weekly Learning Users (WLUs).
A WLU isn’t just someone logging in — it’s a user actively digging into data, running tests, and making strategic decisions. Because if people aren’t learning from Amplitude, they’re not getting Amplitude.
That’s why everything they build — custom reports, better perspectives on user behavior, AI-driven insights — is designed to make analytics faster, smarter, and stickier. When customers rely on Amplitude to make decisions, they stay.
⭐ Duolingo’s North Star Metric: Daily Active Learners — The Gamification of Language
Let’s be real: Learning a new language is hard. But Duolingo? They turned it into an addiction.
Their North Star metric? Daily Active Learners (DALs).
Why? Because if you don’t open the app, you’re not learning. And if you’re not learning, you’re churning.
Every quirky owl reminder, every streak challenge, every gamified feature is engineered to keep you coming back daily. Because once language learning becomes a habit, Duolingo wins.
More DALs mean:
- More users progressing in their learning journey.
- More engagement with premium features (Duolingo Plus).
- More data to improve AI-driven lesson recommendations.
And that’s why Duolingo isn’t just an education app — it’s a lifestyle. Their growth strategy is simple: turn casual learners into paying customers by keeping them hooked.
How do I find my North Star?
Before we dive deep into the dark debris of choosing your north star metric, we should set the record straight.
Global company goals
Define what’s key in your business, what is the true customer value, what generates revenue and determines your progress to find your North Star. But how can you determine what’s key? First, see which goal out of the three below is your key one:
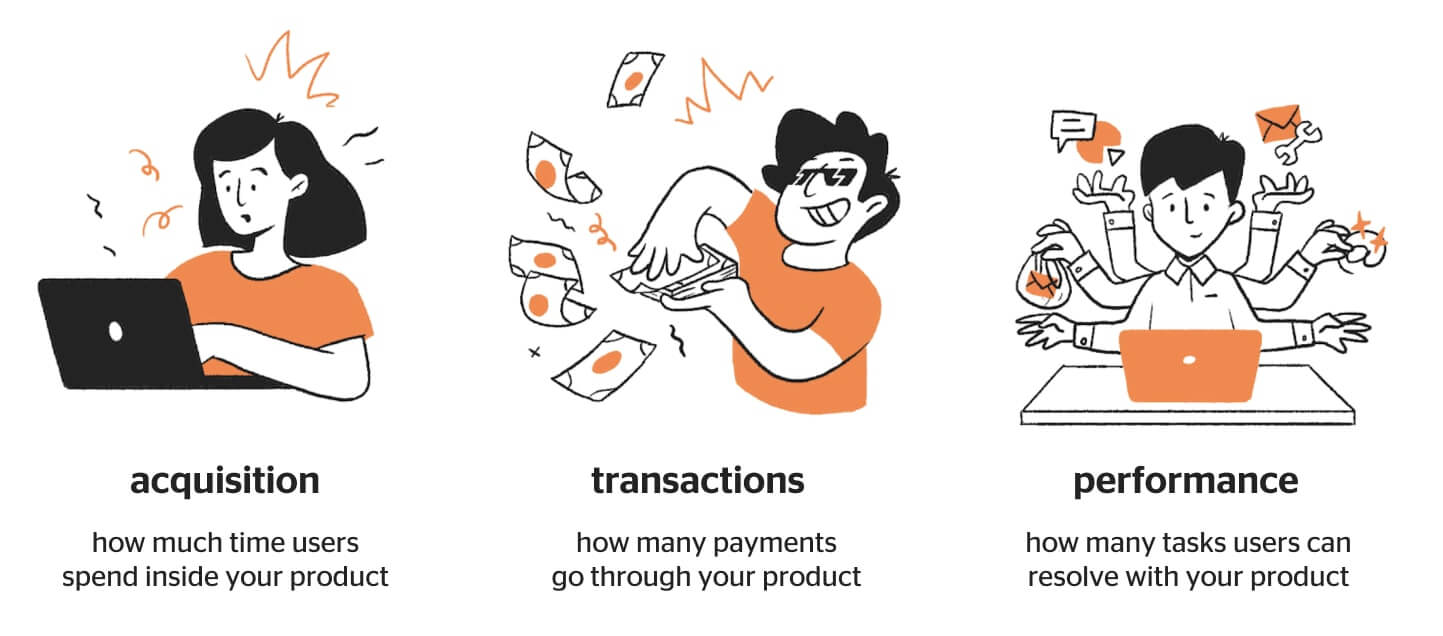
Focusing on one big objective you develop a clear strategy to see clearly where you should go.
Let’s look at the companies with similar global objectives and completely different North Stars. This will help you navigate and see those big goals don’t tie your hands, but rather set your direction and help you stick to it.
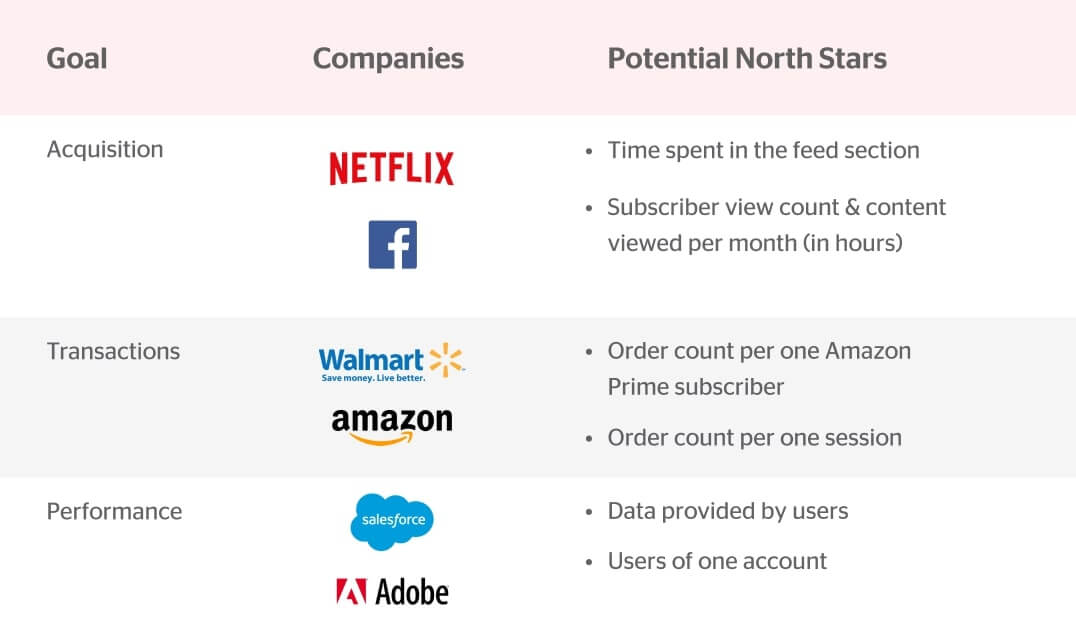
Facebook & Netflix are products where acquisition is key, though they have completely different business models. For Facebook, the time spent in the feed is the North Star. Netflix, in turn, tracks view count and the content viewed per month in hours.
Amazon & Walmart are passionate about transactions but with different North Stars. For Amazon, order count per user is the most important, because their subscription model offers user benefits and probably extends their LTV. For Walmart, the order count per session is a potential North Star Metric.
Salesforce is aiming to be a source of indisputable truth for users because it’s an advanced CRM for sales reps. Their North Star is not actions done within the product, but rather data volumes that users store in their accounts. As for Adobe Creative Cloud, they strive for growing the number of account users.
Input / output product metrics
The North Star metric is always an output. Output metrics demonstrate your outcomes, while input ones consider actions taken.
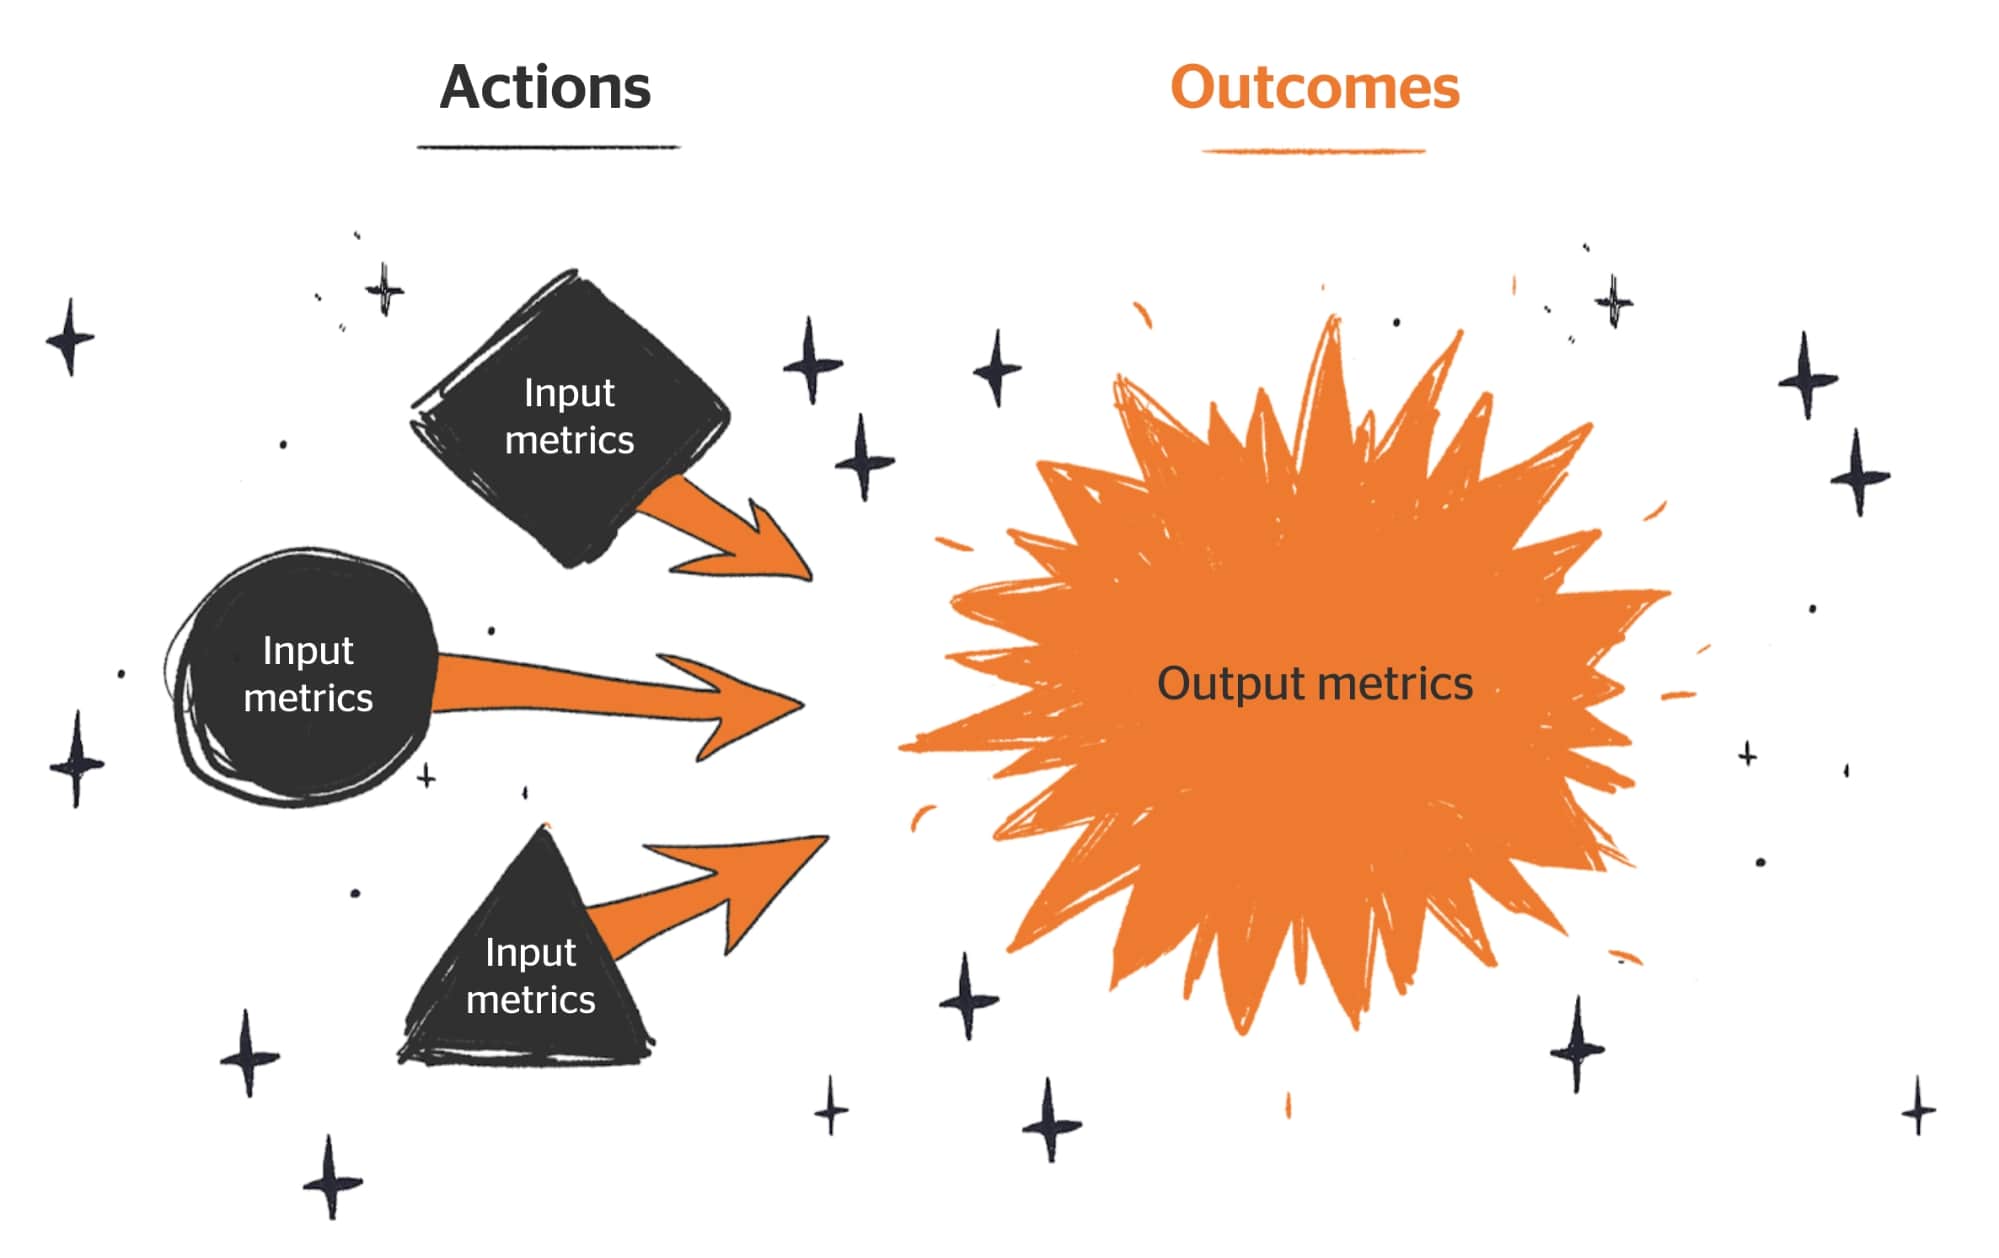
Output metrics help you set long-term objectives for the sustainable growth of your business. For example 100k of MAU; the revenue of $6 mln, the Monthly Recurring Revenue of $10 mln.
Input metrics are actions that influence output metrics:
- 10k views,
- 1000 signups,
- 700 plans purchased.
Output metrics are usually delayed as they don’t let you see how your company is doing right now. It takes some time for output metrics to alarm you about issues, and by that time, it may be too late to change it. Input metrics are leading indicators as they reflect exactly what’s going on in your company.
Don’t just focus on one output metric. They are too general and it’ll be hard for you to evaluate what’s going on and capture declining trends or other issues quickly.
Let’s consider an example of Apple Music. Users get the most product value when they listen to the music. So, their major metric is the time users spend listening to the music. That’s an output metric.
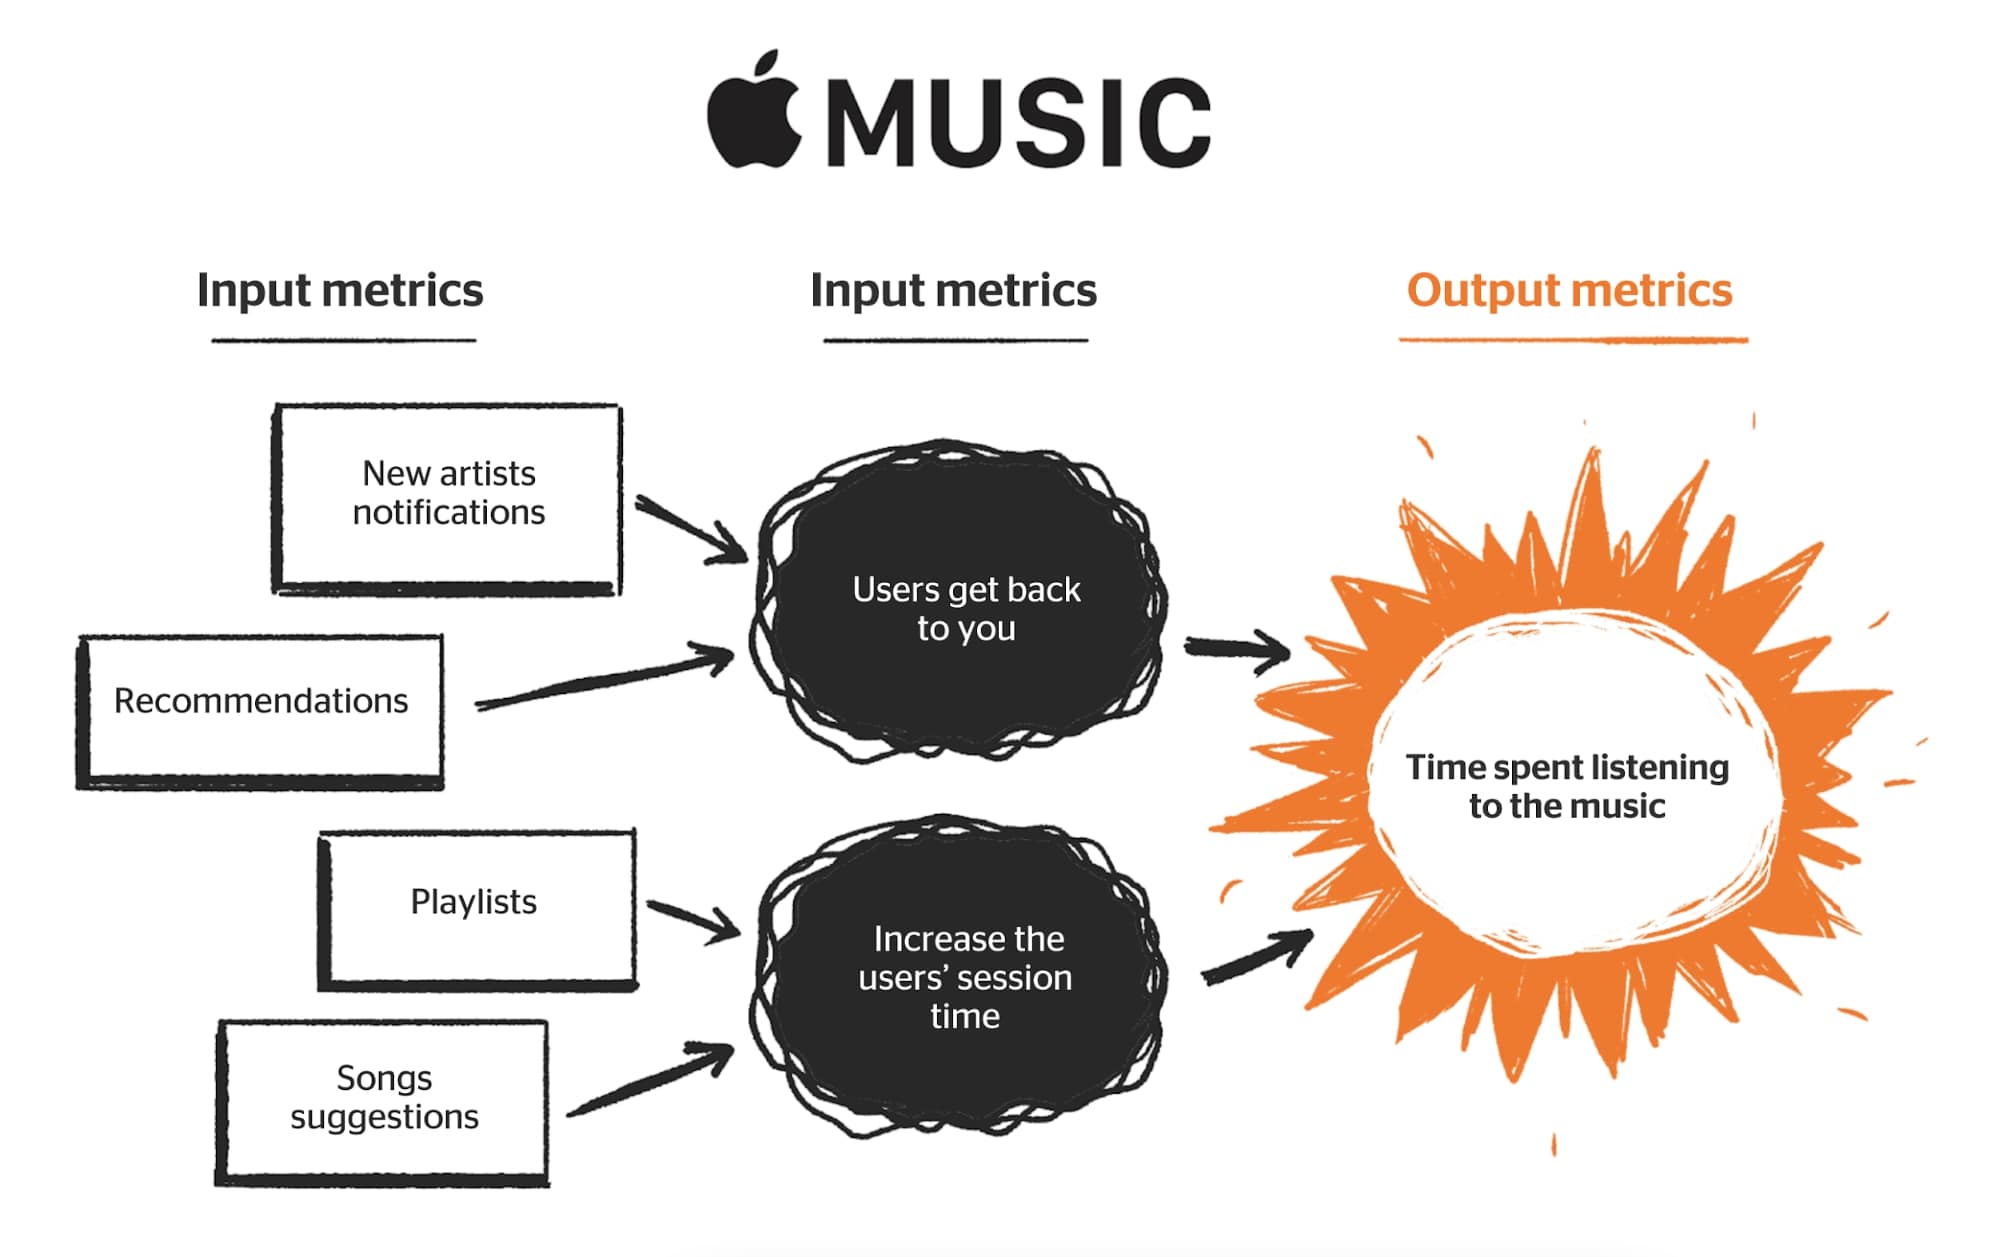
Now let’s see what we can do to improve this metric so that users listen to as much music in the product. These are our input metrics. Probably we can increase the time of user sessions and get them back to the product more often.
Don’t just stop on these input metrics. Move one step further and divide them into more precise steps: notifications on new albums released, recommendations, playlist creation, finding new music, etc.
Choosing the right input metrics
After you define which of the three directions is key for your business, it’s time to determine the KPIs (input metrics) that will help you enhance your chosen direction.
Let’s say you’re developing social media and at that moment you should mostly work on user acquisition. What KPIs can impact your acquisition performance? Define them at this stage and assign them to relevant teams.
Choosing the right output metric (s)
When you choose major KPIs influencing user acquisition, it’s time to set your major metric that would embody all these KPIs.
This metric is going to be your North Star.
Don’t forget the three parameters we discussed before:
- user value,
- rate of return,
- and measurability.
The North Star pyramid
You selected your metric, but it’s hardly the end. Now it’s time to build the hierarchy of metrics where you’ll have your major metric at the top and the KPIs you selected below.
Don’t forget to distribute them across relevant teams that will be responsible for these KPIs.
Four dimensions of the North Star metric

Each North Star metric has 4 dimensions — depth, width, frequency, and performance. So, each KPI can impact one of these dimensions.
Look at the table below. This is the metric hierarchy for a food delivery service. You’ll see what initiatives match the selected KPIs and how, and they, in turn, influence the NSM in different ways.
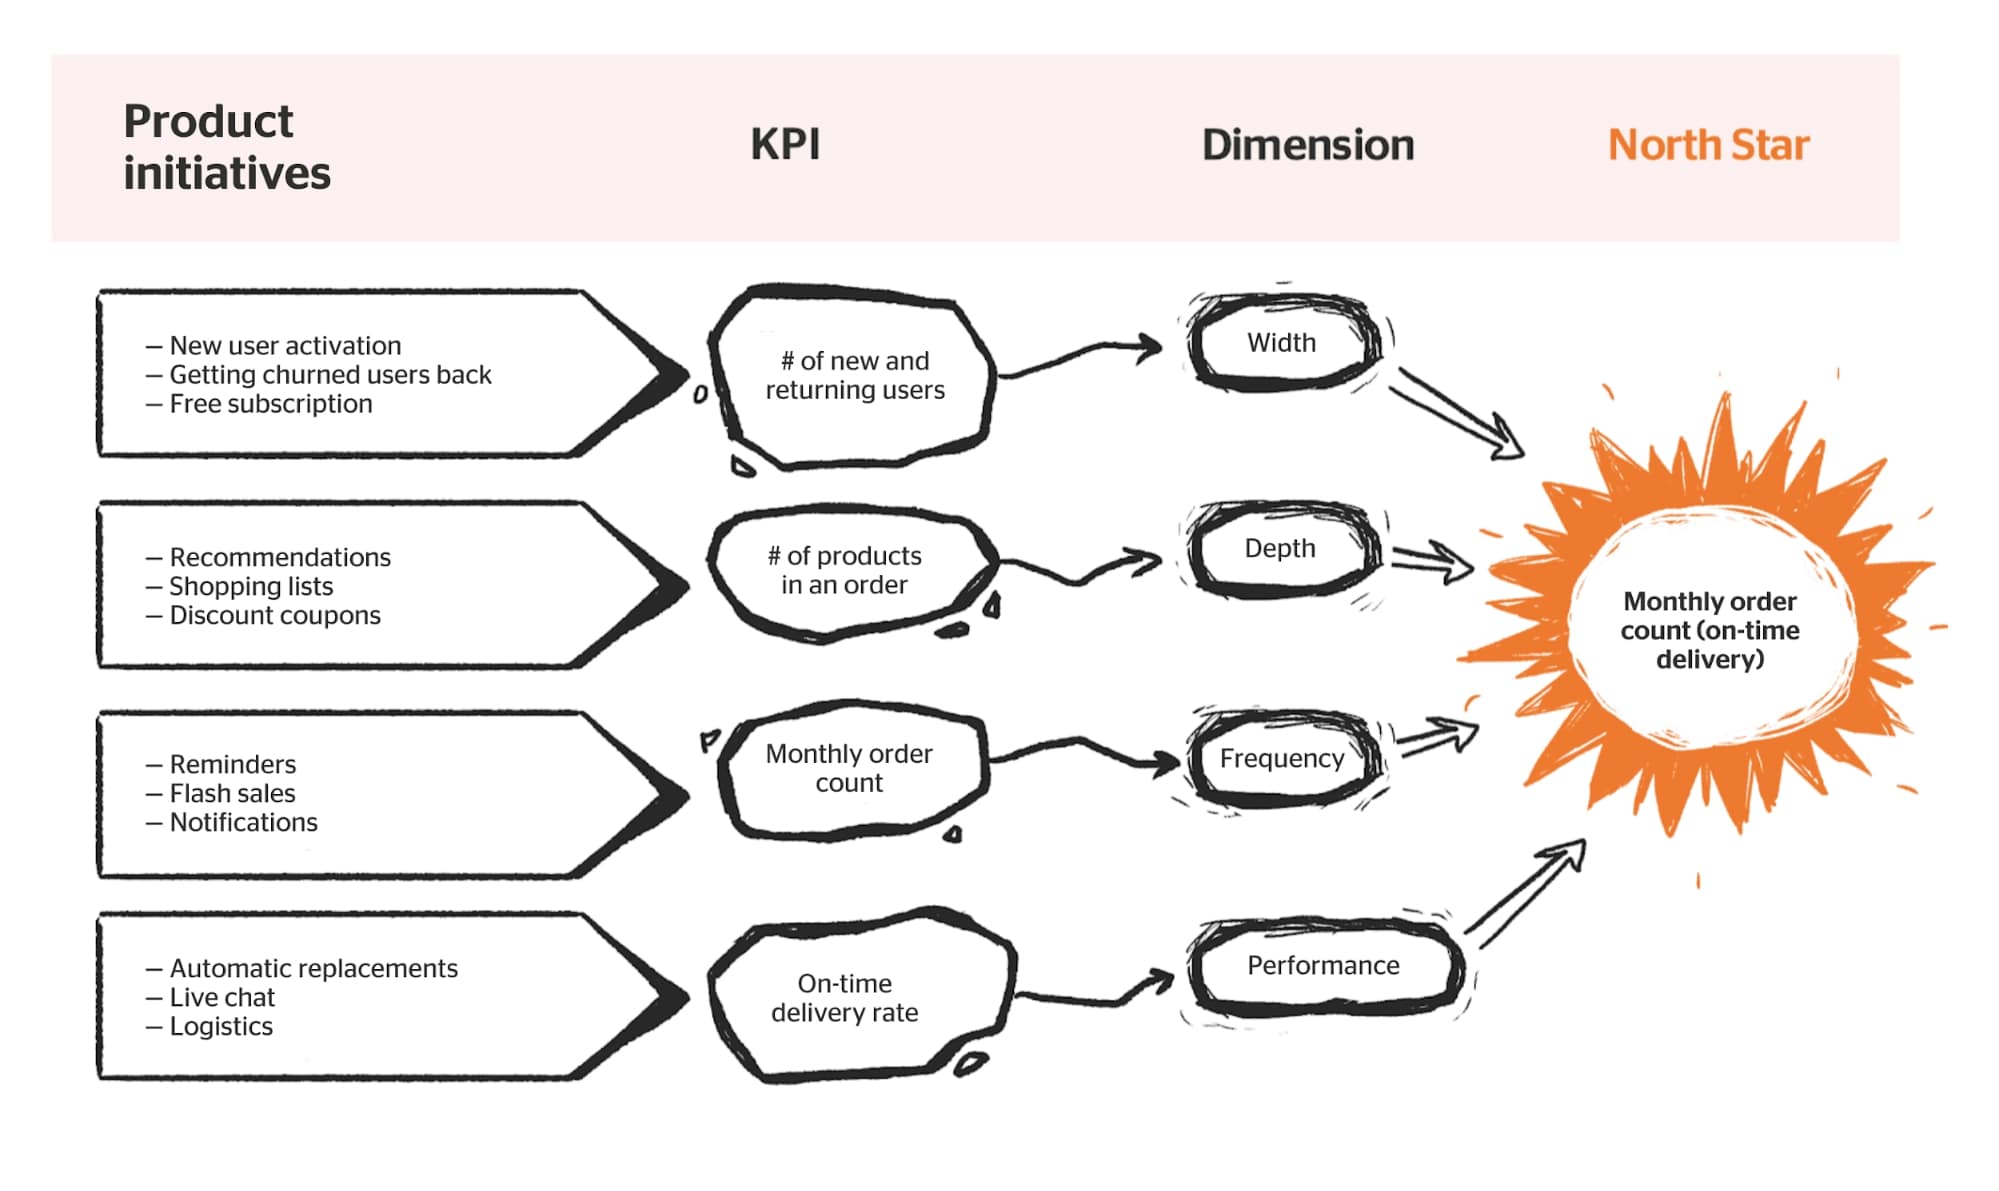
In our case, the North Star Metric is the number of orders delivered on time per month. Width means the number of new and returning users. The initiatives enhancing this KPI are new user activation, returning gone users, and free subscription.
The KPI of the number of goods in an order deals with depth. The initiatives are recommendations, creating shopping lists, discount coupons, etc.
Monthly order count impacts the frequency and this KPI can be improved with reminders, flash sales, and notifications.
The last dimension is performance. The rate of on-time delivery can greatly impact it. You can improve this KPI by a live chat and well-built logistics.
Hopefully, we explained the concept of the North Star Metric well, and soon it will illuminate your way.
The article was written using these precious pieces of content:
- Mixpanel — “What is a North Star metric?”;
- Brian Balfour — “Don’t let your North Star metric deceive you”;
- Amplitude — “Every Product Needs a North Star Metric: Here’s How to Find Yours”.
Grow your conversions with a free marketing audit?
Let’s schedule a 30-minute call and find out how to:
- Improve your website conversion.
- Grow your ROI/ROMI with proven hypotheses that fit your audience.
- Optimize or launch ad channels without additional budget.
- Decrease SLA workload by saving their time on lead processing.

FAQs
It’s the one metric that truly matters — the guiding light for a product manager. It defines success, aligning services, analytics, and experimentation to drive long-term growth. It’s not vanity numbers but a core signal of product quality and value.
A North Star metric is the big-picture goal, while KPIs are the checkpoints. Think of KPIs as the road signs and the North Star as the destination. A product manager tracks both — KPIs measure performance, while the North Star metric ensures services, analytics, and experimentation stay focused on quality and long-term success.
It’s all about watch time. Netflix optimizes services, analytics, and experimentation to maximize how long users stay glued to their screens. More hours watched = higher engagement = stronger retention. That’s the ultimate signal of content quality and platform success.
For Uber, it’s the number of trips. Every product manager, service update, and analytics-driven decision revolves around increasing completed rides. More trips mean better efficiency, improved quality, and stronger network effects — ensuring both riders and drivers stay engaged.


