10 revops metrics and KPIs to track your revenue operations performance
Discover the RevOps formula and how it can utterly transform your company’s financial performance with insights from our experts.

Part 1: Skyrocket your revenue with a complete guide to RevOps Revenue Operations
Part 2: Beginner’s guide to RevOps tech stack
Part 3: 13 revops best practices companies follow this year
Part 4: Rev Ops vs Sales Ops: Know the difference
Part 5: 10 revops metrics and KPIs to track your revenue operations performance
Part 6: Unlocking success: the ultimate revenue growth framework
Keeping track of revenue performance is no small task. As a revenue operations manager, you’re bombarded with countless data points. But which are the ones that really matter? This is where the most important metrics for revenue operations managers and revenue operations KPIs come into play.
For example, customer acquisition costs and net promoter score are just a few of the metrics providing a 360-degree view of your revenue operations performance. In this article, you’ll find the most popular revenue tracking metrics to overcome the problem of ambiguous performance measurement, better understand your business’s financial health, and steer your company toward greater profitability and growth.
Let’s delve into the top 10 RevOps metrics you need to track this year.
What are revenue operations metrics?
When we talk about RevOps metrics, or Revenue Operations metrics, we’re referring to specific measurements or key performance indicators (KPIs) that businesses use to assess and optimize their revenue processes.
These value-packed nuggets of information range from assessing how much you’re spending on customer acquisition (CAC) to how much value those customers provide throughout their relationship with your business (CLV).
Why are they a big deal, you ask? Well, these metrics are like the heartbeat of your revenue operations — they reveal the health of your business at any given moment. They help you track how well your team performs, where you’re spending your money, and how customers perceive and engage with you.
Why measuring revenue operations is important
Here are the most common reasons why revops teams devote time to this task:
- Comprehensive visibility into revenue operations metrics allows businesses to make informed, data-driven decisions that can increase profitability.
- Measuring revenue operations helps in identifying bottlenecks and inefficiencies in marketing, the sales process, enabling businesses to streamline their processes for improved productivity.
- Revenue operations metrics ensure that the sales, marketing, and customer success teams are aligned towards a common goal of optimizing revenue.
- Metrics like MRR and ARR provide businesses with clear visibility into their predictable revenue, helping in long-term planning and stability.
- When companies can track customer acquisition costs against customer lifetime value, they can efficiently allocate budget and resources, reducing unnecessary expenditure.
- Metrics like churn rate, CSAT, and NPS inform businesses about their customer satisfaction levels, enabling them to implement strategies to improve retention and loyalty.
- Measuring revenue growth rate provides operations analysts with a clear indication of whether the company is growing, stagnating, or declining, helping to adjust marketing and sales strategies accordingly.
- Potential investors and shareholders often review a company’s key revenue operations metrics to assess its financial health and future profitability.
Essentially, with these revenue operations KPIs in your arsenal, you get to see a holistic picture of your business’s profitability. Remember, understanding your RevOps metrics is key to building strategies that are laser-focused on growth. Happy revenue tracking!
So what are the most important metrics for revenue operations managers? Here is the list of metrics the Dashly team uses to measure its revenue 👇
Customer Acquisition Cost (CAC)
This is a crucial metric among revenue operations KPIs, representing how much it costs to acquire a new customer. This includes all the costs spent on marketing, sales, products, services, and any other costs associated with persuading a potential customer to buy a product or service.
The goal is to keep CAC as low as possible to increase overall profitability.
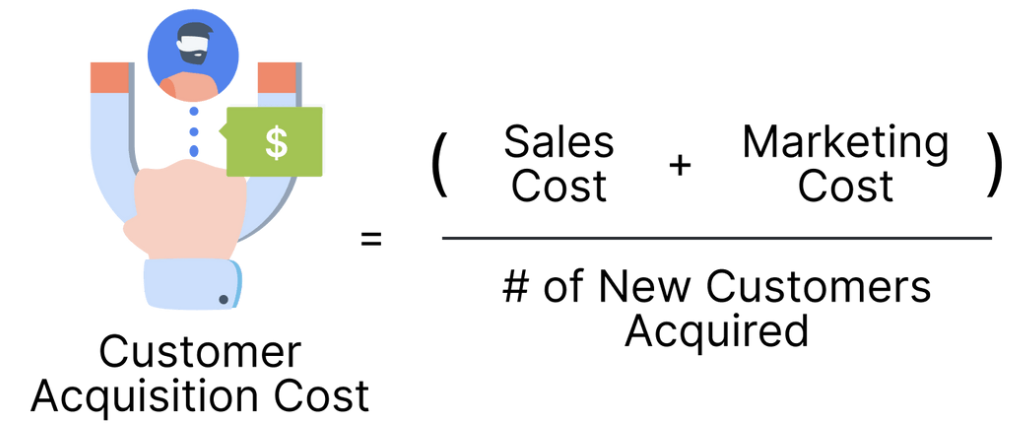
CAC is typically calculated by dividing the total costs associated with acquisition by the total number of new customers, within a given time period. So here’s what data your team needs to calculate it 👇
CAC = Total Marketing and Sales Expenditure / Number of New Customers Acquired
For example:
Consider a SaaS company, XYZ Ltd., that spent 200,000 / 400 = $500 per new customer.
Customer Lifetime Value (CLV)
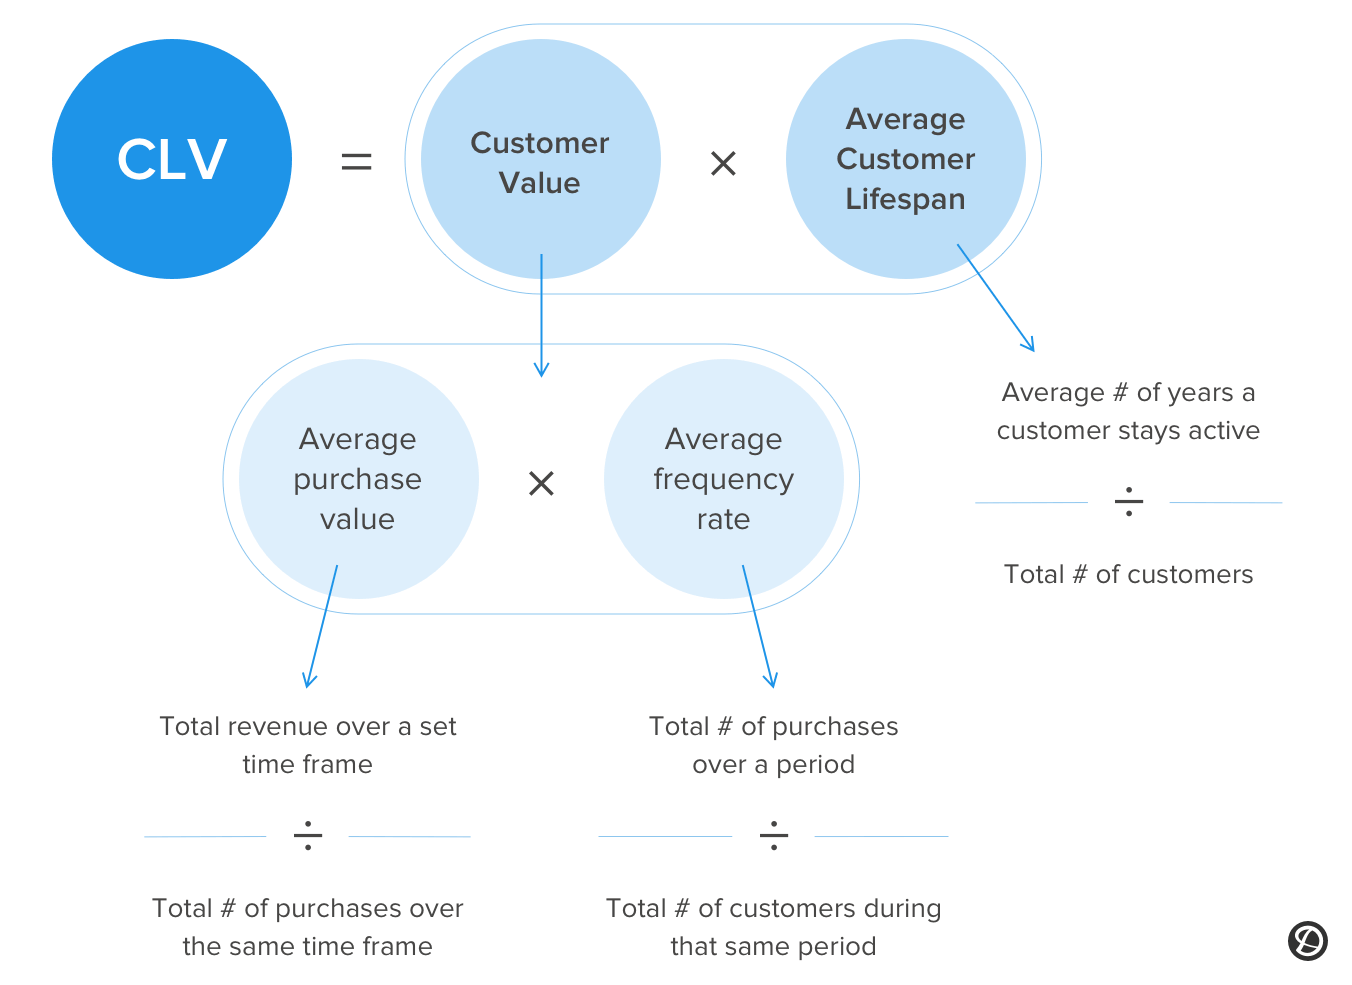
CLV is a prediction of the total revenue a business can make from a single customer. It aims to identify the profitability of maintaining long-term relationships with customers. What data you need to calculate CLV:
CLV = Customer Revenue per Year * Customer Relationship in Years — CAC
For example:
For XYZ Ltd., assume an average customer brings in a yearly revenue of 500. Then CLV: 500 = $5,500.
Lead Conversion Rate (LCR)
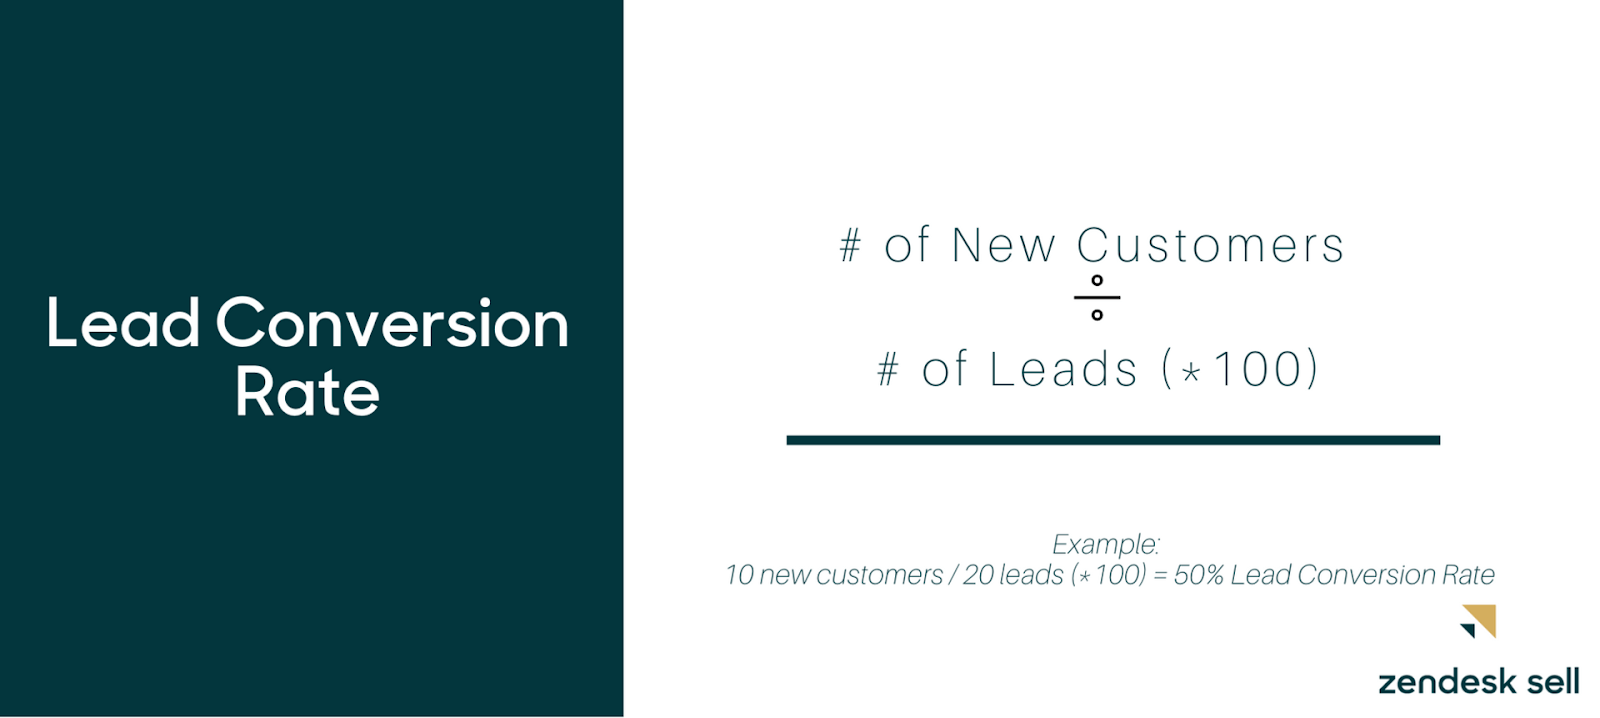
This is one of the essential RevOps metrics, indicating the percentage of leads that are converted into customers. It measures the effectiveness of your sales or marketing efforts in converting leads into qualified leads and then to paying customers. It also gives businesses insights into the efficiency of their sales funnel and their sales and marketing strategies.
The goal is to maximize the LCR for improved sales productivity and higher revenues. Here’s what data your team needs for measuring this metric:
LCR = (Number of Successful Conversions / Total Leads Generated) * 100%
Example for marketing:
Let’s take a look at another SaaS company, AlphaMetrics, a provider of a cutting-edge marketing analytics platform. They generate qualified leads through multiple channels like content marketing, seminars/webinars, marketing automation, and PPC advertising.
In a specific month, let’s say they generated a total of 1,000 leads through these activities. By the month’s end, the team managed to convert 80 of these leads into paying customers.
The formula for calculating Lead Conversion Rate (LCR) is: LCR = (Number of Successful Conversions / Total Leads Generated) * 100%
So, for AlphaMetrics, the LCR for that month would be: LCR = (80/1,000) * 100% = 8%
This suggests that AlphaMetrics converted 8% of their total leads into customers that month. These data are important for AlphaMetrics because they help gauge the efficiency and effectiveness of its overall marketing and sales strategies.
Should their LCR be lower compared to industry benchmarks or their past performance, they might need to enhance their lead nurturing process, adjust the quality of leads sourced or improve their sales pitch. Conversely, a high conversion rate indicates that their lead generation and conversion strategies are working well, so the team might decide to invest more in those successful marketing tactics to boost their customer base, sales, and revenue.
Increase Lead Conversion rate on your website with Dashly experts for free
Let’s schedule a 30-minute call and find out how to:
- Improve your website conversion.
- Grow your ROI/ROMI with proven hypotheses that fit your audience.
- Optimize or launch ad channels without additional budget.
- Decrease SLA workload by saving their time on lead processing.

Customer Churn Rate
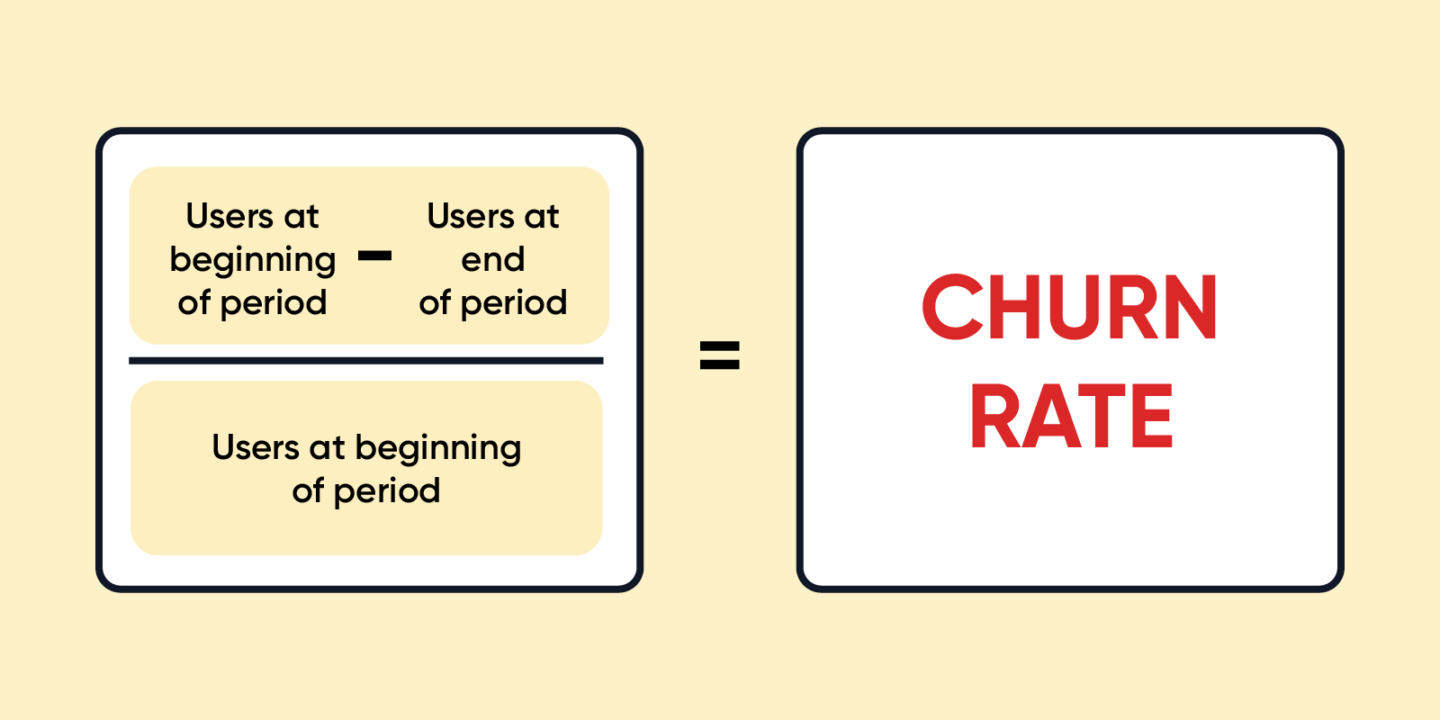
Churn Rate, also known as customer attrition rate, is a business metric that calculates the number of customers who leave a product over a given period of time, divided by the remaining number of customers.
Churn rate measures how many customers stop using a product or service over a given period. The goal is to keep this rate as low as possible to ensure sustainable growth and revenue. It’s a crucial measure in businesses, especially subscription-based or service-based businesses, as it shows the rate at which your client base is shrinking.
Here’s what data your team needs to measure this metric:
Churn Rate = (Number of Customers at the Beginning of the Period — Number of Customers at the End of the Period) / Number of Customers at the Beginning of the Period * 100%
For example:
Suppose at the start of the period, XYZ Ltd. had 1,000 customers, and by the end, it was left with 950. Then, the churn rate would be (1,000 — 950) / 1,000 * 100% = 5%.
A high churn rate could indicate customer dissatisfaction, cheaper and/or better solutions from the competition, ineffective user onboarding, low customer retention rate, or the lack of success in customer loyalty programs.
By contrast, a low churn rate suggests customers are satisfied with your service or product and remain loyal to the brand. Reducing your churn rate can lead to significant growth in customer value and overall business revenue. So keep track of these data.
Monthly Recurring Revenue (MRR)
As one of the core revenue operations KPIs, MRR represents the predictable revenue a company expects to earn every month. The goal is to maximize MRR for steady business cash flow.
MRR = Sum of all Recurring Revenue for the Month
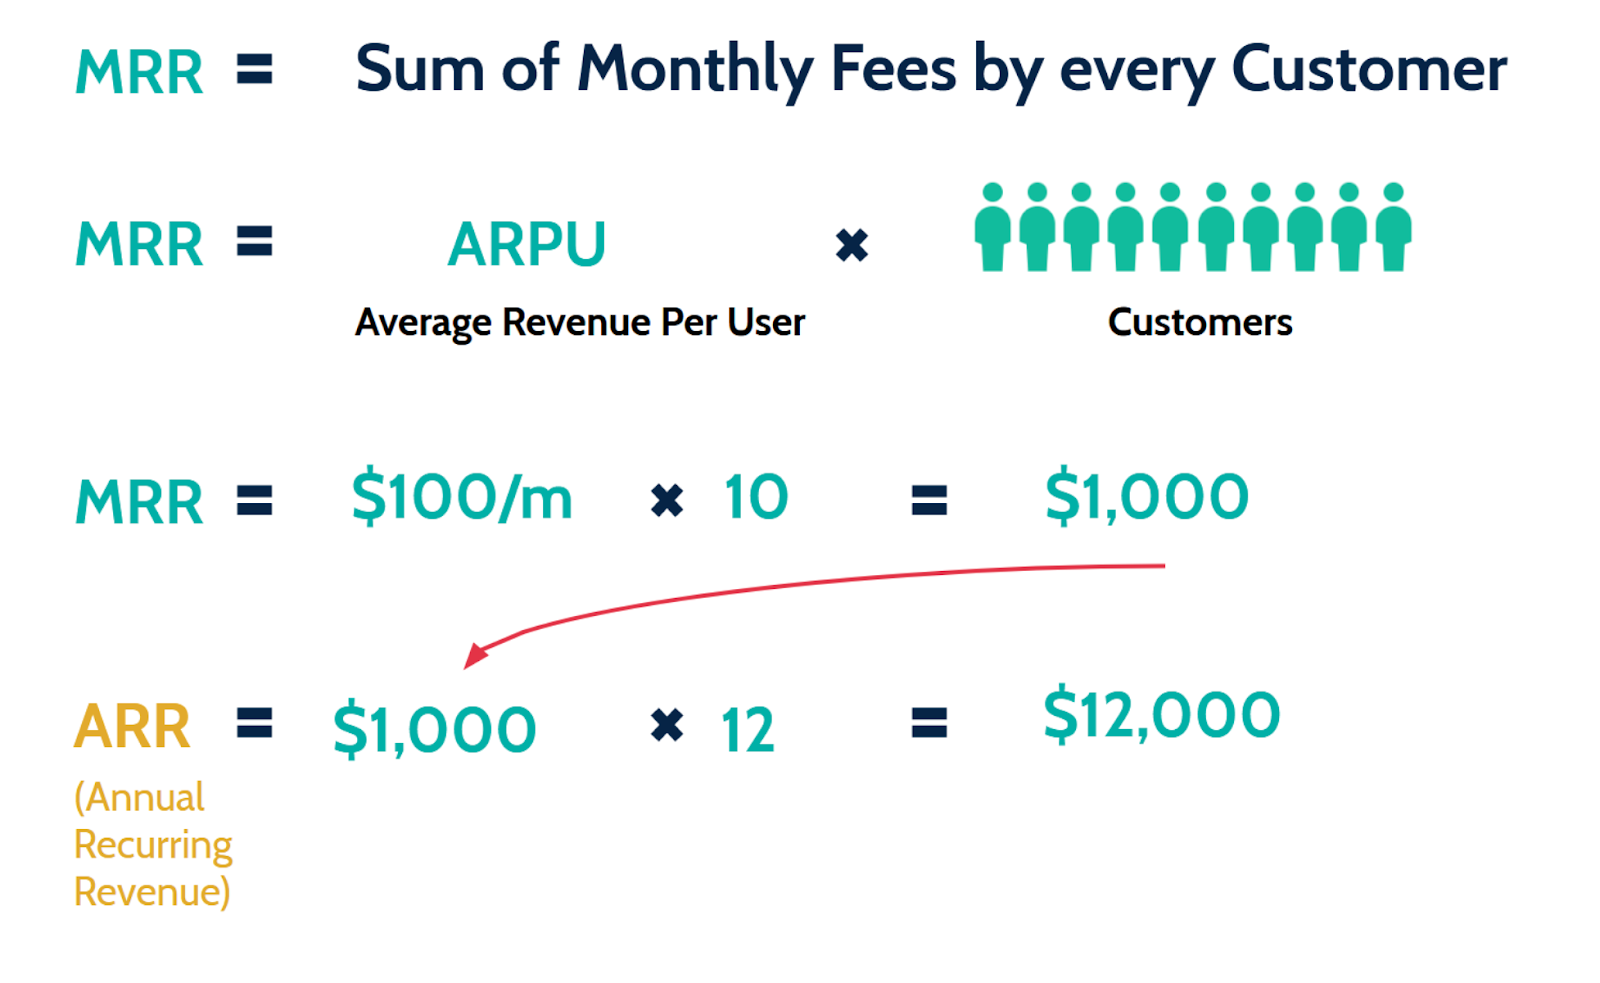
For example:
For XYZ Ltd., if they have 500 subscribers paying 20 = $10,000.
Read also:
- What is sales enablement? Definite guide + Strategy + Tools for 2024
- How to measure success: 20+ sales enablement metrics to track in 2024
- Harnessing the power of AI sales enablement: 5 strategies to transform your sales process
- 10 steps to building a sales enablement strategy in 2024
- 7-steps guide on how to create an automated sales funnel in 2024: examples & tools
- 7 sales enablement best practices to empower your team and boost performance
- 10 sales enablement tools: Best software to grow your team performance
- Guide on sales enablement team structure: 10 roles and responsibilities
- Mastering sales automation: A comprehensive guide to best practices and tools
- Sales and marketing automation: How to align their workflow to 2x revenue [Dashly example]
- Top 13 sales automation tools to propel your sales strategy
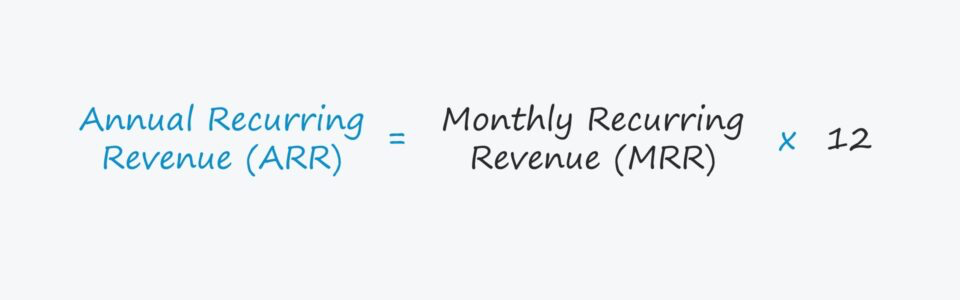
Annual Recurring Revenue (ARR)
ARR measures the value that a company’s customers commit to recurring fees over a year. Like MRR, the goal here is to maximize ARR.
ARR = Sum of all Recurring Revenue for the Year
For example:
Let’s imagine a SaaS company, we’ll call it CloudSoft. CloudSoft offers popular project management solutions customized for remote teams. They have a variety of packages, but for simplicity, let’s say their standard package costs $300 per year and they have 1,500 customers on that package.
The formula to measure Annual Recurring Revenue (ARR) is quite straightforward: ARR = Total Yearly Recurring Revenue of customers
So, for CloudSoft, you would calculate the ARR by multiplying the revenue from the standard package by the number of customers.
ARR = 450,000.
So, CloudSoft’s ARR, based solely on their standard package, would be $450,000.
This metric is incredibly important to CloudSoft. Why? Well, as a SaaS company, much of CloudSoft’s revenue comes from recurring customer subscriptions. By measuring ARR, the team can effectively predict its revenue for the next year.
This data is crucial for budgeting, forecasting future growth, and informing strategic decisions about resources and personnel. Should the ARR demonstrate strong growth, it’s a strong signal for CloudSoft to continue its current marketing and sales strategies, and it would make their business even more attractive to potential investors.
Raise conversion rates and boost your annual revenue with Dashly free audit
Let’s schedule a 30-minute call and find out how to:
- Improve your website conversion.
- Grow your ROI/ROMI with proven hypotheses that fit your audience.
- Optimize or launch ad channels without additional budget.
- Decrease SLA workload by saving their time on lead processing.
Sales Cycle Length
This metric tracks the average time it takes for a lead to move from the top of the sales funnel to becoming a buyer. Sales Cycle Length is measured in time (typically in days). Measurement begins from the point of first contact (like an initial email, call, or meeting) and ends when the sale is finalized.
Sales Cycle Length helps organizations understand how various factors, such as product type, market conditions, sales performance, pricing strategies, and more, might affect the length of sales cycles. So it’s a metrics sales learn and track regularly.
Shortening the sales cycle length is the primary goal.
What data you need to measure the metric 👇
Sales Cycle Length = Sum of Time Taken for All Deals / Number of Deals
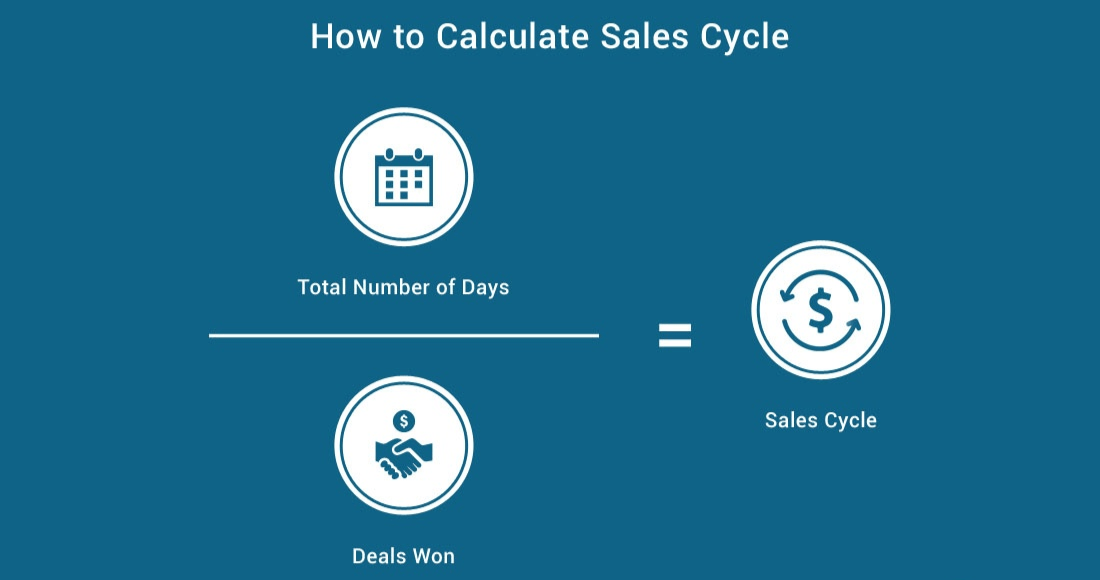
Example for sales and marketing:
Suppose XYZ Ltd. closed 50 deals in a year. It tools sales the total time of 750 days to close these deals. The average sales cycle length is: 750 / 50 = 15 days.
Revenue Growth Rate
This metric tracks the percentage increase or decrease in a company’s sales between two given periods. The objective is straightforward — driving revenue growth. Here are data you need to track the metric:
Revenue Growth Rate = (Revenue this Period — Revenue Last Period) / Revenue Last Period * 100%
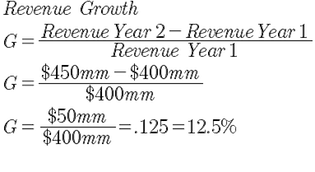
For example:
XYZ Ltd. made 100,000 this quarter. The revenue growth rate would be: (90,000) / $90,000 * 100% = 11.11%.
Customer Satisfaction (CSAT) Score
CSAT Score measures how well a business meets customer expectations. High CSAT Scores generally correlate with high customer retention, so improving CSAT is crucial.
CSAT Score = (Number of Positive Responses / Total Responses) * 100%
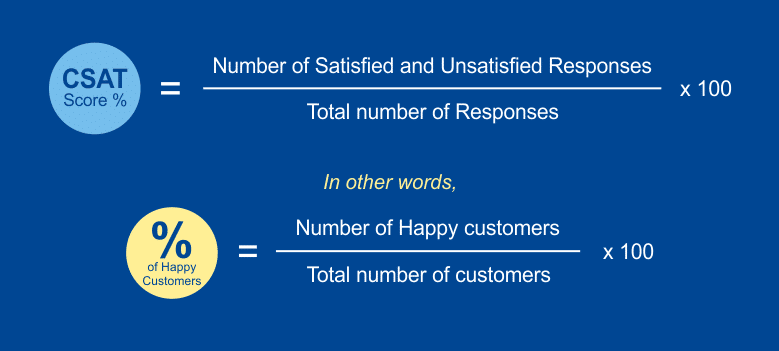
For example:
If XYZ Ltd. had 100 respondents to their survey, with 80 giving positive feedback, the CSAT score would be: (80/100) * 100% = 80%.
Net Promoter Score (NPS)
This critical RevOps metric measures customer loyalty and their willingness to recommend your product or service to others. The goal of NPS is to gauge the general sentiment and loyalty of your customer base. Thus, you’ll know if you need to unleash your creative side and enhance customer experience (communication, onboarding, etc.) 😉
NPS = % of Promoters — % of Detractors
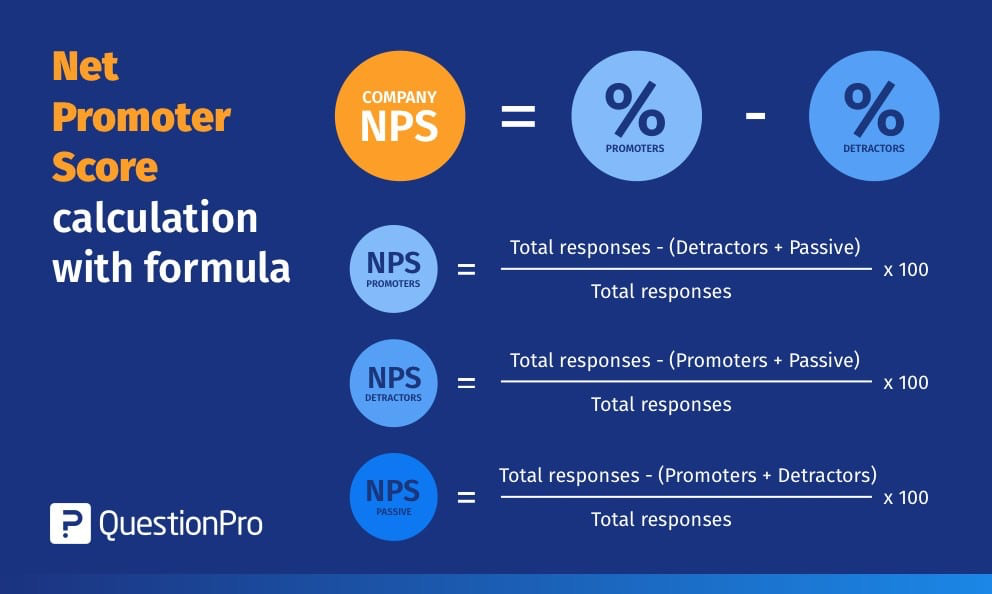
For example:
For XYZ Ltd., if they had 50% Promoters (those who’d recommend them) and 10% Detractors (those who wouldn’t), the NPS score would be: 50% — 10% = 40%.
Want to get a free marketing audit?
Let’s schedule a 30-minute call and find out how to:
- Improve your website conversion.
- Grow your ROI/ROMI with proven hypotheses that fit your audience.
- Optimize or launch ad channels without additional budget.
- Decrease SLA workload by saving their time on lead processing.
FAQ on revenue operations
What are RevOps metrics?
RevOps metrics are the key performance indicators (KPIs) used by a company to measure the effectiveness of their revenue operations. RevOps data include financial metrics, operational metrics, and customer-related metrics that provide insights into the company’s sales, customer relations, and revenue growth.
Why are RevOps metrics important?
RevOps metrics are critical for making informed decisions about a company’s growth strategy. They allow companies to evaluate operational performance, detect inefficiencies, assess customer satisfaction, and quantify financial performance.
What is Customer Acquisition Cost (CAC)?
CAC is a critical revenue operations KPI that shows the cost to acquire a new buyer. It includes data like marketing and sales expenses and is used to evaluate the return on these investments.
How do I lower my CAC?
To lower your CAC, consider optimizing your sales and marketing strategies. This might involve enhancing your targeting strategy, improving conversion rates, or investing in more cost-effective channels.
What is Customer Lifetime Value (CLV) and why is it significant?
CLV is the predicted revenue a company can earn from a customer over the length of their relationship. It’s significant as it helps identify the profitability of retaining customers versus acquiring new ones.
What is churn rate and how does it impact revenues?
The churn rate is the percentage of customers who stop using your product or service over a given period. A high churn rate can significantly lower revenues and profitability since it’s often cheaper to retain a customer than to acquire a new one.
So it’s one of the primary metrics services learn and track. It indicates if you should enhance customer experience (improve user communication/onboarding, etc.)
How can MRR and ARR be increased?
There are multiple opportunities to increase the MRR and ARR. For example, acquiring new customers, reducing churn rate, increasing the price of the product, or selling additional services or features to existing customers.
What’s the importance of a CSAT score?
Customer Satisfaction (CSAT) score helps determine how well a company meets its customers’ expectations. High CSAT scores often correlate with customer retention, repeat business, and positive word-of-mouth marketing.
What are revops kpis?
Revenue Operations (RevOps) KPIs, or key performance indicators, are metrics used to measure the performance and effectiveness of an organization’s revenue operations. These metrics offer insights into various aspects of business functionality, helping teams align across sales, marketing, and customer success.
Here are a few examples:
- Customer Acquisition Cost (CAC),
- Customer Lifetime Value (CLV),
- Lead Conversion Rate (LCR),
- Customer Churn Rate.
Read also:
- RevOps tech stack: free guide to the best tools
- Product led growth metrics: 13 key indicators for SaaS companies to track
- PLG tools: ultimate free guide to the best instruments
- Benefits of Product led growth: 12 PLG benefits for your business
- Top 10 product led growth software your competitors use in 2023
- 10 product led growth companies that boost their development right now
- Sales led growth: what is it and why your business needs it
- Unlocking success: the ultimate revenue growth framework
- AARRR Metrics: unleashing the Power of the AARRR Framework for Business Growth
- Growth marketing case studies: 12 stories with detailed tactics and numbers achieved
- RevOps best practices: 13 tactics to implement this year


Subscribe to Dashly newsletter
Join the community of 13,000 pros who get expert insights on marketing, support, and sales in a weekly newsletter


