16 Essential Sales Funnel Metrics You’re Probably Not Tracking (But Should Be)
Sales funnel metrics and sales pipeline metrics — sounds fancy, right? But trust me, they’re essential to grow your SaaS company’s sales. As someone helping SaaS teams boost their sales with Dashly, I can tell you these metrics give you a front-row seat to the inner workings of your sales process.
Whether it’s tracking how many leads are dropping off at the top of the funnel or figuring out why deals are stalling in your pipeline, these metrics tell you the full story. And honestly, without them, you’re flying blind.
In this article, we’ll dive into the 16 sales metrics that matter most for keeping your sales pipeline healthy and your funnel flowing. Buckle up because once you start tracking these, you’ll wonder how you managed without them!
What are sales funnel metrics?
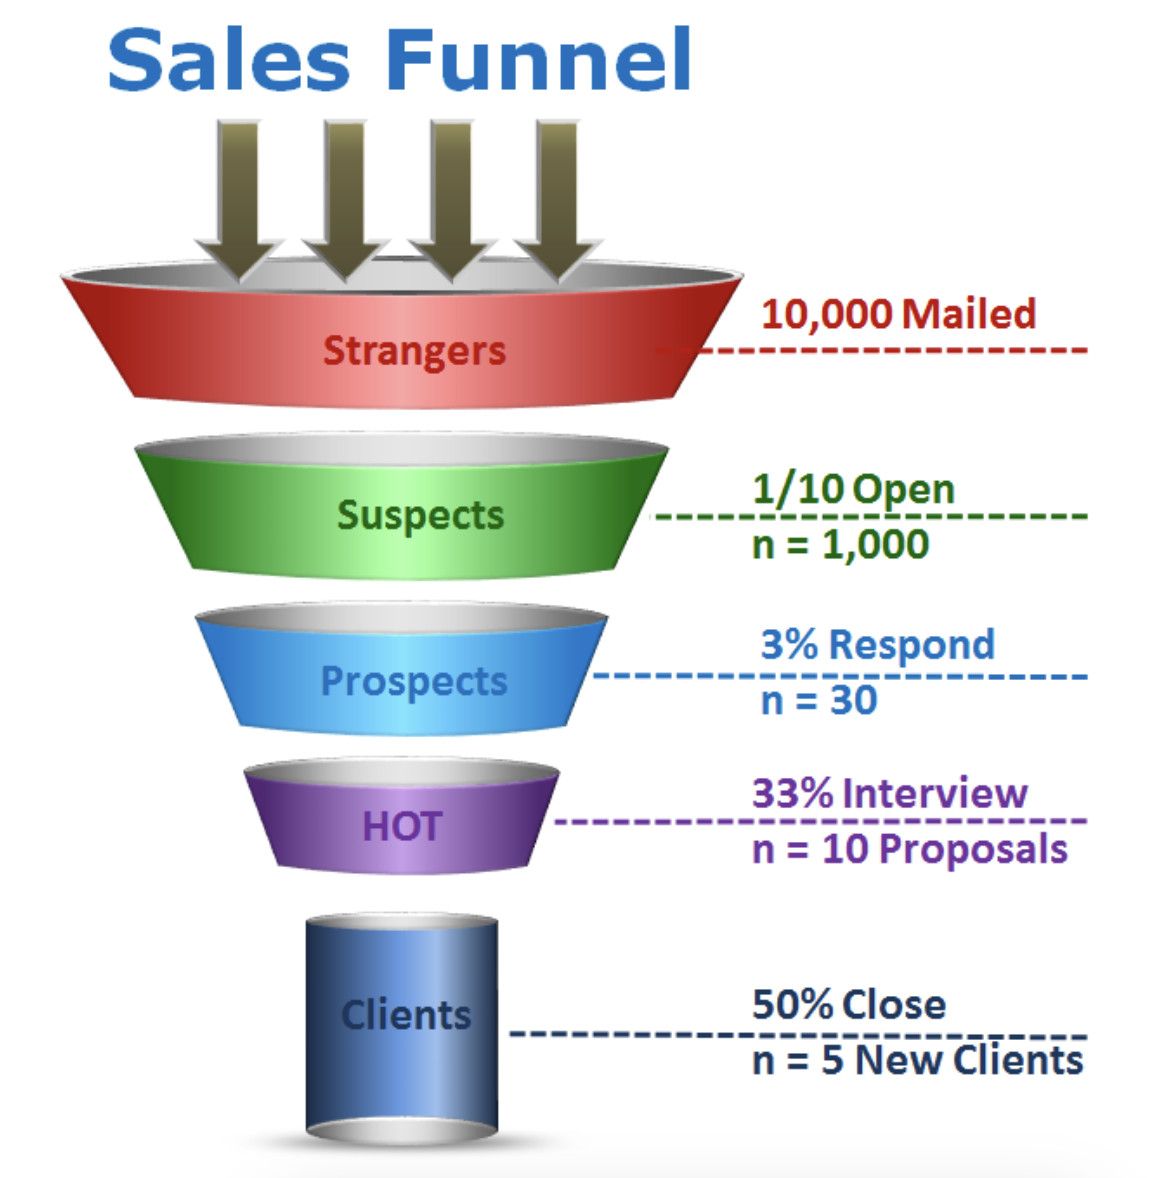
Sales funnel metrics are the data points that tell you how well your leads are moving through the funnel. They help you track every stage, from that first touchpoint to the closed deal.
Let’s break it down by funnel stage:
When should you start measuring these?
Honestly, as soon as your SaaS company has a steady flow of leads. You don’t need a huge sales team, but once you’ve got a funnel, start tracking sales funnel metrics.
Why? Because waiting too long could mean missed opportunities to improve your sales funnel conversion rate.
Why Sales Funnel Metrics Matter for Sales and Marketing Alignment
Why do sales funnel metrics matter? Simple — they’re the glue that holds your sales and marketing teams together. When both teams are tracking the same sales funnel metrics, magic happens. Here’s why measuring these metrics is a game-changer for SaaS companies, based on what we see every day at Dashly:
- Clear visibility. Measuring your sales conversion funnel gives both teams a clear view of what’s happening. Marketing sees which campaigns bring in qualified leads, and sales know which leads to prioritize. There are no guessing games.
- Improved targeting. When you use sales funnel tracking, you can see exactly which leads are moving through the funnel and which ones are dropping off. Marketing can adjust its targeting, and sales can focus on the hot leads. That’s alignment, baby!
- Better communication. Tracking sales funnel conversion rates means marketing and sales speak the same language. They’re both using data to back up their strategies. No more finger-pointing when targets are missed — just collaboration based on real numbers.
- Higher conversion rates. Companies with aligned sales and marketing teams experience 67% higher sales funnel conversion rates. When both sides track the measurement funnel, they can tweak their efforts together to increase efficiency and close deals faster.
- Faster problem-solving. When something’s off — like a big drop in lead quality or a bottleneck in the funnel — you’ll know immediately. Measuring the funnel lets you troubleshoot fast, saving time and money. I’ve seen this play out with Dashly clients: one B2B SaaS client spotted a 30% drop in middle-of-the-funnel conversions. With that data, they quickly pivoted, revamped their outreach, and fixed the problem in a week.
- Boosted revenue. Alignment isn’t just about good vibes. It drives revenue. Companies with aligned teams generate 208% more revenue from marketing efforts. Measuring the funnel helps you understand where the money is made — and where it’s lost — so you can double down on what works.
Want to align your teams and get your funnel flowing? Start measuring those sales funnel metrics. It’s a no-brainer. I’ll give you a metric conversion cheat sheet to ensure you’re tracking the right things at every step.
Read also: The Top 10 Benefits of Sales Funnels and Their Purpose for 2025
The 16 most useful sales funnel metrics
Tracking the right sales funnel metrics is a part of how we at Dashly help countless SaaS companies fine-tune their sales processes and grow revenue. After working with these companies, we know exactly which metrics make the biggest impact. Let’s dive into 16 of the most useful ones that keep your sales funnel conversion rates high and your teams aligned.
1. Lead Volume
This is where it all begins — tracking how many leads enter your funnel.
Formula: Total number of leads generated over a specific period.
For example, one Dashly client generated 1,000 leads per month but had no idea what that number meant without comparing it to other metrics. Looking at lead volume in relation to funnel metrics, they quickly realized their conversion rates were dropping despite the high number of leads.
How to improve ➡️ Focus on generating quality leads, not just quantity. Use tools like quizzes, pop-ups, or AI-driven content creation to engage visitors and move them further down the funnel.
2. MQL to SQL Conversion Rate
This metric shows how many marketing-qualified leads (MQLs) turn into sales-qualified leads (SQLs). It’s a huge indicator of how well your marketing efforts are working.
Formula: (SQLs / MQLs) * 100
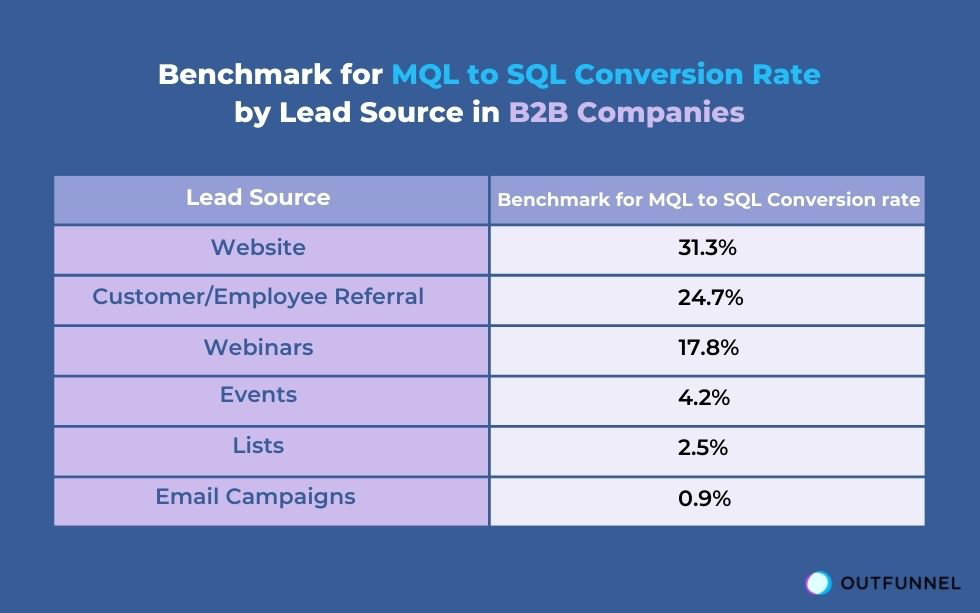
Let’s say you generated 500 MQLs, and 150 became SQLs. Your MQL to SQL conversion rate would be 30%. For one SaaS company, we found that tweaking their lead-nurturing emails boosted this number by 20% in just a month.
How to improve ➡️ Optimize your lead-nurturing emails with relevant, personalized content that speaks directly to each lead’s pain points. AI tools can help create these faster.
3. Lead-to-Customer Conversion Rate
This metric tracks how effective your funnel is at converting leads into paying customers. In other words it is a sales funnel conversion rate.
Formula: (Number of customers / Number of leads) * 100
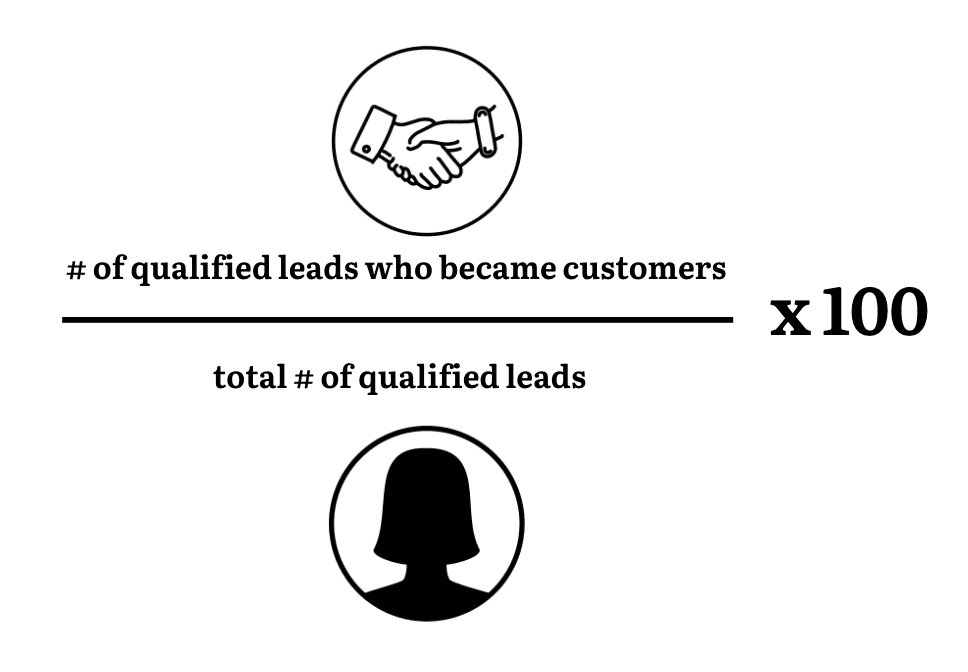
For example, if you had 1,000 leads and 50 turned into customers, your lead-to-customer conversion rate would be 5%. One SaaS client found that most of their leads dropped off at the demo stage. After refining their demo process, they saw a 3% conversion bump.
How to improve ➡️ Focus on providing real value during the demo stage. Use interactive content to engage prospects and answer their key concerns.
4. Lead-to-Meeting Conversion Rate
The lead-to-meeting conversion rate measures how effectively your team turns leads into scheduled meetings. This is a critical metric in the sales funnel, especially in B2B, where meeting with a potential customer is often the first step toward closing a deal.
Formula: (Number of scheduled meetings / Number of leads) * 100
For example, if your team generates 200 leads and schedules 50 meetings, your lead-to-meeting conversion rate is 25%. One Dashly client saw a low rate of 10% before implementing automated lead nurturing campaigns and AI chatbots. After optimizing their process, they boosted the rate to 30%.
How to improve ➡️ Use personalized follow-up emails, automated scheduling tools, and AI bots to engage leads. Make it easy for leads to book a meeting and follow up promptly after initial contact.
5. Funnel Drop-Off Rate
This tells you how many leads drop out of your funnel at each stage.
Formula: (Number of leads leaving the funnel at a stage / Total number of leads at that stage) * 100
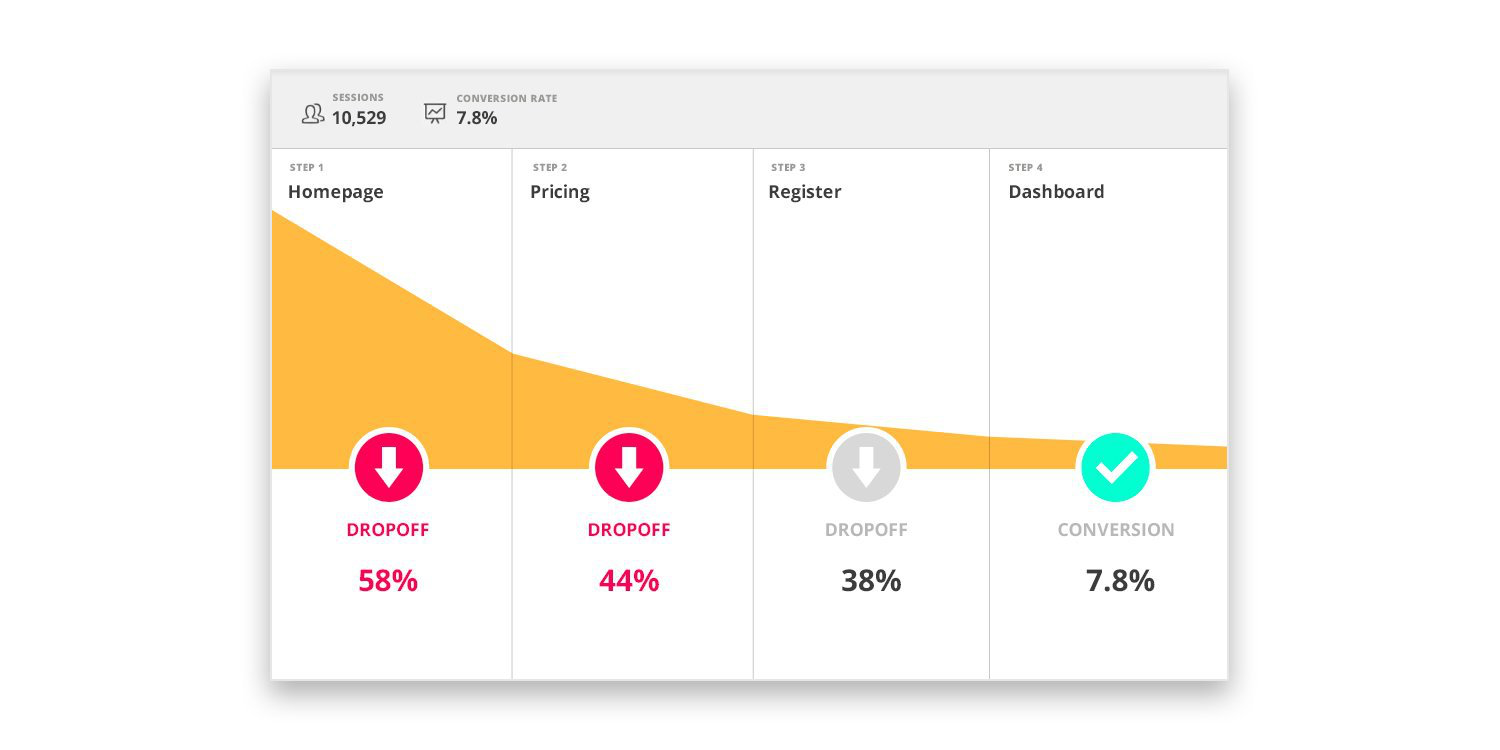
A client using Dashly’s AI-driven SDR found that their drop-off rate at the “meeting booked” stage was 40%. With targeted outreach and better lead nurturing, they reduced it to 25%.
How to improve ➡️ Identify the pain points causing drop-offs. Often, it’s a lack of personalized follow-up or unclear next steps. Automating these processes can keep leads moving forward.
6. Opportunity-to-Win Ratio
This metric measures how many opportunities convert into won deals. It’s a crucial indicator of your sales team’s ability to close deals after they enter the sales funnel.
Formula: (Number of won deals / Number of opportunities) * 100
For example, if you have 100 opportunities and win 30 deals, your opportunity-to-win ratio is 30%. One Dashly client noticed their ratio was low, around 15%, and after refining their sales scripts and personalizing outreach, they raised it to 25%.
How to improve ➡️ Focus on improving sales training, objection handling, and follow-up processes. Ensure that each lead receives personalized attention based on their specific needs.
7. Average Deal Size
This tracks the average revenue per closed deal and helps you understand the value of each customer.
Formula: Total revenue from closed deals / Number of closed deals
One client had an average deal size of $10,000, but after upselling additional features during the sales process, they bumped it to $12,000.
How to improve ➡️ Train your sales team to upsell and cross-sell during the negotiation stage. Offering additional features or premium plans can significantly increase deal size.
8. Sales Qualified Leads (SQL) to Opportunity Conversion Rate
This metric tracks how many SQLs become active opportunities in the funnel. It shows the effectiveness of the handoff from lead qualification to the actual sales process.
Formula: (Number of opportunities / Number of SQLs) * 100
For instance, a Dashly client had a 40% conversion rate from SQL to opportunity. By improving their lead qualification process with better targeting, they increased this rate to 55%.
How to improve ➡️ Strengthen your lead qualification process. Ensure that SQLs are highly qualified before moving them into the pipeline, focusing on those with the highest potential to convert into opportunities.
9. Sales Pipeline Velocity
This shows how quickly deals are moving through your funnel.
Formula: (Number of opportunities * Average deal size * Win rate) / Sales cycle length
A Dashly client saw their pipeline velocity increase by 15% after reducing manual follow-ups and using automated tools for quicker responses.
How to improve ➡️ Speed up your follow-up process. Use AI bots and automated messaging to keep leads engaged without delay.
10. Customer Lifetime Value (CLV)
This metric shows the total revenue a customer will bring to your business over their lifetime.
Formula: Average purchase value * Number of purchases per year * Customer lifespan
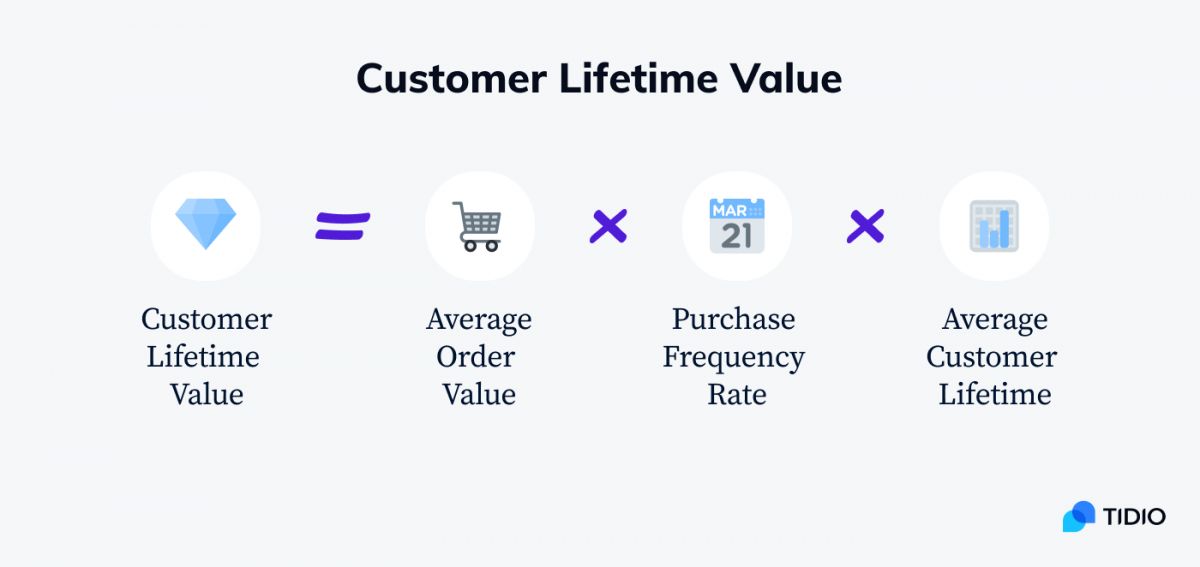
If a customer spends $1,000 yearly and stays with you for 3 years, their CLV is $3,000. One client found that focusing on upselling additional services increased their CLV by 20%.
How to improve ➡️ Upsell more to existing customers. Keep them engaged with new features, premium plans, or additional services.
11. Churn Rate
This tracks how many customers leave your service within a given period.
Formula: (Number of customers lost / Total customers at the start of the period) * 100
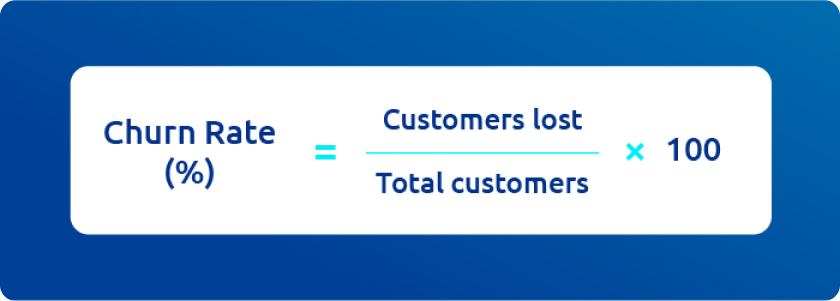
A Dashly client reduced their churn rate by 10% by introducing personalized, AI-driven customer success campaigns.
How to improve ➡️ Focus on customer retention through regular check-ins and offering proactive solutions to common problems.
12. Lead Response Time
This metric measures how quickly your team responds to new leads after they express interest. A quick response can significantly increase your chances of booking a meeting.
Formula: Time between lead generation and first response (average time)
For example, if your average response time is 1 hour and you manage to cut it down to 15 minutes, you’ll see a big improvement. One Dashly client reduced their response time by implementing automated chatbots to handle initial outreach, which increased their lead-to-meeting conversion rate by 20%.
According to industry data, the optimal response time is under 5 minutes. Companies that respond within 5 minutes are 100x more likely to connect with leads
How to improve ➡️ Use automated responses, like chatbots or email sequences, to ensure leads receive immediate attention. You can also prioritize high-intent leads to respond even faster.
13. Follow-Up Attempts per Lead
This metric tracks how many follow-up attempts it takes to schedule a meeting. It helps you understand the persistence required to convert a lead into a meeting.
Formula: Total number of follow-up attempts / Number of leads
For example, if you follow up three times on average before lead books a meeting, but some leads take six attempts, your overall persistence might need adjusting. A Dashly client found that increasing follow-ups from two to four touchpoints improved their conversion rate by 15%.
It typically takes 6-8 follow-up attempts to contact a lead, but many companies stop after 2-3 attempts, leaving opportunities on the table.
How to improve ➡️ Create a structured follow-up sequence with varied methods—email, phone, social media — to ensure consistent touchpoints without overwhelming the lead.
14. No-Show Rate
This metric tracks the percentage of leads who book a meeting but don’t show up. A high no-show rate can waste your team’s time and effort.
Formula: (Number of no-shows / Number of scheduled meetings) * 100
For example, if 10 out of 50 scheduled meetings result in no-shows, your no-show rate is 20%. One Dashly client reduced their no-show rate from 25% to 10% by sending automated reminders before each meeting.
The average no-show rate is around 20-30% in the B2B space.
How to improve ➡️ Send reminder emails or texts 24 hours before and on the meeting day. Offer easy rescheduling options in case the lead can’t attend.
Read also: A Complete Guide to B2B Sales Funnel for 2024 Success
15. Lead Qualification Rate
This metric shows how many of the leads that enter your funnel are qualified to move forward to the meeting stage. It’s a key indicator of lead quality.
Formula: (Number of qualified leads / Total number of leads) * 100
For example, if you generate 100 leads but only 20 are qualified, your qualification rate is 20%. One SaaS client working with Dashly saw their qualification rate increase from 25% to 40% after refining their lead scoring process.
In the B2B SaaS industry, a lead qualification rate of around 25-35% is typical, though top performers can see rates as high as 50%.
How to improve ➡️ Improve your lead qualification process by using clear criteria for a qualified lead. Implement AI-driven lead scoring to automatically prioritize high-quality leads.
16. Email Open Rate (for Meeting Requests)
This metric tracks how many leads open the emails you send with meeting invites or proposals. A higher open rate means your subject lines and timing are on point.
Formula: (Number of emails opened / Number of emails sent) * 100
For example, if you send 100 emails and 50 are opened, your open rate is 50%. After tweaking subject lines and email timing, one Dashly client increased their open rate from 40% to 60%.
The average email open rate for B2B SaaS is around 20-30%, though well-targeted, personalized campaigns can see rates of 40-50%.
How to improve ➡️ Experiment with subject lines, send times, and personalization. Use A/B testing to see what works best and optimize your outreach.
How to choose the right metrics
How do you choose the right sales funnel metrics? It’s easier than you think. Let’s break it down so you can focus on the metrics that matter most for your SaaS company.
- Understand your funnel: First, you need to know the structure of your funnel. What stages are involved? Lead generation, MQLs, SQLs, demos? Knowing this will help you choose relevant funnel metrics for each stage.
- Match metrics to goals: Every metric should relate to a specific business goal. For example, if you want more meetings, track the MQL to SQL conversion rate. If you want faster deals, focus on sales pipeline metrics like time-to-close. Always ask, “Does this metric help me reach my target?”
- Track the whole journey: Don’t just focus on one stage. Use sales funnel tracking to monitor the entire buyer’s journey, from awareness to closing. This will highlight where leads get stuck or drop off.
- Measure what’s actionable: Only track metrics you can influence. If you can’t directly change it, it’s just noise. For example, if your sales funnel metrics show a low SQL conversion rate, focus on improving lead qualification or sales outreach. You need to act on the data.
- Align sales and marketing: Ensure your teams are on the same page. Both should track sales pipeline metrics that reflect shared goals, like improving the MQL to SQL conversion rate. This keeps everyone aligned and working toward the same outcomes.
- Don’t go metric-crazy: Stick to 5-7 key metrics. More than that, and you’re drowning in data. Focus on the metrics that provide the most insights into your funnel.
By picking the right sales funnel metrics, you’ll have a clear picture of your funnel’s health and can quickly spot areas to improve.
Common Mistakes in Tracking Sales Funnel Metrics
Here are some common mistakes I’ve seen when tracking sales funnel metrics. You’d be surprised how many teams fall into these traps, but don’t worry — I’ve helped SaaS companies like yours avoid them.
- Tracking too many metrics. One client was drowning in data. They tracked 20+ B2B sales funnel metrics and couldn’t focus on anything meaningful. It’s simple: too much data equals no clarity. Stick to the most impactful sales funnel KPIs — keep it lean and actionable.
- Ignoring the middle of the funnel. Many teams obsess over the top and bottom of the funnel but forget about the middle. One client saw high lead volume and strong closes but missed that their sales funnel conversion rate was dropping in the demo stage. Don’t overlook the middle!
- Not aligning sales and marketing. Here’s a big one. If marketing is tracking one set of marketing sales funnel metrics and sales another, there’s a disconnect. A SaaS client had a great lead flow, but their sales funnel conversions were tanking because the sales team didn’t think the leads were qualified. Align those teams!
- Chasing vanity metrics. I’ve seen clients get excited about flashy numbers like website visits. Cool, but if they don’t impact your sales funnel conversion rates, they’re just vanity metrics. Focus on what moves the needle, like SaaS sales funnel metrics that show lead progression and close rates.
- Ignoring lead quality. One company generated a ton of leads, but its sales funnel conversion rate was terrible. Why? They didn’t qualify leads properly. If your funnel is full of low-quality leads, your sales funnel KPIs will always be off.
- Forgetting about optimization. A client of mine had been tracking the same B2B sales funnel metrics for years without tweaking their approach. Metrics only matter if you use them to make improvements. Funnel tracking is an ongoing process!
Avoid these mistakes, and you’ll get clearer insights from your saas sales funnel metrics. Trust me, it’ll save you a ton of frustration down the road!
FAQ
Sales funnel metrics are the data points that show how leads move through each stage of your sales funnel, from awareness to closing. They give you a clear picture of your sales process’s effectiveness.
They help you spot bottlenecks, optimize conversions, and make data-driven decisions. Without tracking these, you’re guessing what’s working in your sales process.
Key ones include lead-to-MQL conversion rate, MQL to SQL conversion rate, sales funnel conversion rates, and time-to-close. These metrics show you how well your funnel is flowing.
Focus on improving lead qualification, personalizing outreach, and speeding up response times. Also, analyze where leads drop off in the funnel and refine those stages.
Compare your metrics against industry standards for B2B sales funnel metrics, such as MQL to SQL conversion rates (25-30%) and win rates (20-30%). These benchmarks will give you context.
Common mistakes include tracking too many metrics, focusing on vanity numbers, and misaligning marketing and sales efforts. The biggest pitfall? Not using the data to take action and improve your funnel.
Read also:
– Guide to sales funnel optimization: best tips, tools, and common pitfalls;
– 10 inspiring sales funnel examples to boost your business growth;
– The Upside Sales Approach: Master the Inverted Funnel for Maximum Growth;
– Sales Funnel Stats That Matter: Boost Conversions and Growth in 2024;
– Mastering sales funnel analysis: step-by-step guide, tools, and examples;
– Ultimate guide to an AI sales funnel: the best tips, tools and common mistakes to avoid.