Google’s Core Web Vitals: Winning Organic Traffic

Google recently updated its page ranking algorithms. Now pages that are equally friendly on mobile or PC, meet user requests, load fast, and improve customer experience will be ranked highest.
If your website doesn’t meet these requirements, it’ll be ranked lower. Read on to see how algorithms work and how you should work on your pages.
What are Core Web Vitals?
In May 2020, Google announced they were developing page ranking criteria. Google is going to evaluate website friendliness using these criteria.
In November 2020, they told the new criteria were going to be enacted effective in May 2021. In May 2021, the update release was postponed for a month.
Starting from mid-June, the page friendliness criteria will be considered for page ranking. This update is intended to make search results more relevant and rank quality, friendly websites higher. Low Core Web Vitals scores can probably be the final straw that will turn into a failure.
Webmasters, SEO specialists, and developers should know these criteria and how they can be improved. The criteria are:

LCP (Largest Contentful Paint) shows how long it takes for the largest element (image or text) to load.
FID (First Input Delay) shows the average time the browser takes to react to the first user action.
CLS (Cumulative Layout Shift) is an element shift indicator during page loading.
You can track these criteria using these platforms:
- PageSpeed Insights give you a helicopter view.
- If you need more details, go to Google Search Console or Lighthouse.
- WebPageTest is the source for a deep dive.
How Will It Impact Page Ranking?
We’ve talked to SEO specialists from several industries to see if they like the current ranking and what they expect after the release.
Eugene, a webmaster, an SEO guru, improving PageSpeed scores for WordPress websites, says:
If you consistently grow your link mass, care for E-A-T and technical criteria including Core Web Vitals, your website’s ranking will gradually increase. You can’t just buy links anymore. You should thoroughly work on your link building.
Improve your technical parameters such as loading speed and user-friendliness with Google suggestions. All parameters briefly called PageSpeed Insights positively impact your website ranking. However, it’s not like that with some websites. If your referential traffic is bad, the quality of your website content is poor, and your website isn’t at least preliminarily optimized, your website boosting won’t result in any significant change. I think that explains why webmasters agree to ignore PageSpeed.
Of course, it all depends on your industry and the website itself. There are websites with an empty referential profile, but great technical and Core Web Vitals scores, and they are ranked among the top 10 in search results for complex queries.
Core Web Vitals (LCP, CLS, FID) are already presented in Search Console. That’s why they undoubtedly act as ranking criteria. What’s even more, their impact has become more remarkable since mid-2020. Some of my customers’ websites lost their ranking positions, but after we worked on the loading speed, their rankings started to recover.
Core Web Vitals metrics are just one of the ranking criteria, therefore you should work on them along with other website improvements.
Now everyone wonders, will their websites with low PageSpeed Insights scores plummet after an update? I think we won’t see a massive downfall. Though, it will depend on a variety of factors.
Julia, Head of SEO at IT-Agency, says:
Google’s updates are designed to rank user-friendly websites higher, regarding both the user queries and their experience on a website. We don’t expect any significant change in this position. However, we expect some changes after a complete rollout of the update. For example, ranking factors can be reweighed. Websites are more likely to win higher rankings if they are equally friendly on mobile or tablet, they’re optimized and don’t make users wait, they fully meet user queries with all intents, and facilitate and improve user experience.
Where did the updates begin?
1. Mobile-First Index
On March 26, 2018, after many months of quality assurance, Google announced the implementation of the Mobile-First Index. Having an efficient mobile website has become an important ranking factor for Google. Webmasters whose websites were prioritized in mobile ranking received notifications about that in Google Search Console.
Google planned to implement this Mobile-First approach to all websites since September 2020, but it was postponed till March 2021 due to the COVID-19 pandemic.
We, the SEO gurus, keep forgetting about mobile traffic. Yeah, it’s all beautiful on desktop, but users live with small portable screens. Mobile devices require a high loading speed. However, speed is not only technical, it’s also a behavior factor.
2. Medical update (Florida)
Since 2018, Google’s been regularly announcing core updates. The first one was the so-called “medical” update that impacted medicine-related and YMYL (Your Money Your Life) websites like ecommerce, financial services, payday loans, etc. On August 1-2, 2018, there was an upsurge in search results.
Google started to evaluate websites considering the health, life, and financial wealth of people more strictly. After all, these websites should provide authentic information from trustworthy sources.
3. E-A-T (expertise-authoritativeness-trustworthiness)
Google’s core updates that followed from September 2018 to September 2019 influenced factors that can be merged in the E-A-T acronym:
E stands for the author’s expertise level. Health and wealth-related subjects should only be discussed by these fields’ experts.
A means the authoritativeness of the author or the whole website. The more often the content or the expert is cited, the more authoritative the resource is considered.
T stands for the website’s trustworthiness. The resource should gain the user’s trust via high-quality content, specifying all contact, payment, delivery, and warranty details if necessary.
Since 2019, the new era of the YMYL websites has begun. Website owners should publish trustworthy content so the algorithm doesn’t alert about a website.
4. Google BERT
On October 22, 2019, Google announced an update of the BERT (Bidirectional Encoder Representations from Transformers) algorithm. This neural network-based algorithm understands queries in a natural language, that’s why search results are now based on the query intent, not just the meanings of keywords. The word order, prepositions, the context, and the query intent are considered in this algorithm.
5. May 2020 Core Update
The algorithm update was rolled out on May 4, 2020, and impacted YMYL and other websites. Here’s what changed in the way search results are generated:
- links to social media started to appear on the SERP more often;
- large websites monopolized search results for low- and mid-frequency queries.
6. Core Web Vitals: implementation in 2021
As we mentioned earlier, in summer 2020, Google announced Core Web Vitals that evaluate the quality of a website. Google is going to use this name as an umbrella brand for its website performance tracking resources: Lighthouse, Chrome DevTools, PageSpeed Insights, Search Console’s Speed Report, and Chrome User Experience Report.
Putting the metrics to good use
When users visit your website, browsers give your website Core Web Vitals scores. That’s the major difference from artificial tests that don’t help with real-world issues and can’t cover your website quality issues. The audience may treat your website differently from the artificial test results.
Now, we’ll talk about these indicators in more detail and how you can improve them.
1. Largest Contentful Paint (LCP)
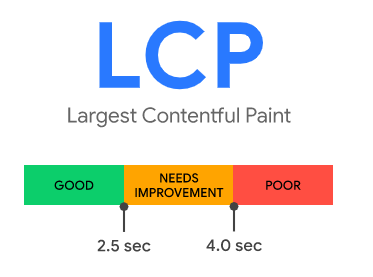
LCP shows the render time of the largest element visible on the screen, an image or a text block.
From the user’s perspective, this metric is a perceived load speed in seconds.
Here’s what values LCP can take in seconds:
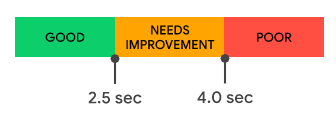
0 to 2.5 seconds is the best time for a good user experience;
2.5 to 4 seconds can be acceptable, but you’d rather optimize your content then;
4 seconds and more mean the element takes very long to load, so you need to make it lighter.
What elements are considered to calculate the LCP:
- <img>,
- <image> elements inside an <svg> element,
- <video> elements,
- an element with a background image loaded via CSS,
- block-level elements with text nodes or other inline children elements like div with the text inside.
If an element exceeds the viewport, is cropped, or has some content hidden for a scroll, these parts are not considered for an element size.
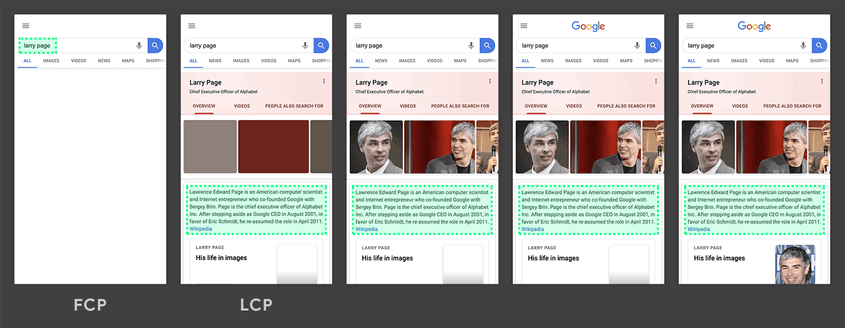
The largest element on Google’s SERP is a text paragraph that’s shown before any image or logo finishes loading. All other images are smaller than this paragraph, so it remains the largest element.
What usually affects this metric?
- Slow server response time: the database speed and script execution on the server. Plus, everything happening on the back end, server remoteness from a user, and the Internet speed;
- Render-blocking JavaScript and CSS;
- Resource loading time;
- Client-side rendering (relevant for single-page applications).
Measurement tools
You can track the LCP using field and lab tools.
Field tools analyze the experience of real-world users:
Search Console (Core Web Vitals report)
Lab tools imitate the page loading process and analyze it:
Improving the LCP
- Define the largest page element. If it’s an image, make sure it’s not postponed and preload it. If it’s a text, preload fonts and add them to HTTP/2 Push.
- Optimize the weight of the largest element or prepare images of the right size and compress them using https://tinypng.com/.
- Don’t use inline elements like background images.
- If you can’t speed up image loading, focus on other elements.
- Simplify the first screen design.
- Apply the PRPL pattern (preload, render, pre-caching, lazy loading).
- Optimize rendering using progressive page rendering with JS files.
- Optimize the CSS: load the CSS asynchronously loading files using JS.
- Optimize web fonts: avoid invisible text during font loading, reduce the font size, or compress fonts.
- Optimize JavaScript for client-rendered websites (SPAs, JS frameworks), so HTML content renders using JS, not the server.
2. First Input Delay (FID)
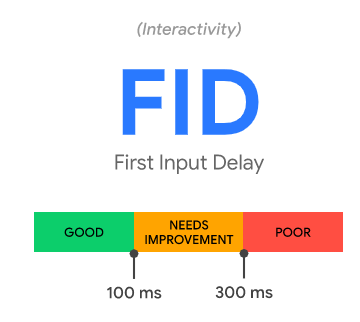
This user-centric metric is a maximum potential delay. The FID measures the time from the first user interaction with a page to the time when the browser can respond to the interaction (a click, scroll, etc). It normally occurs when the browser’s main thread is busy with something else, so it can’t respond to a user for a while.
From the user’s perspective, it’s perceived as a device’s speed. However, delays occur on the front end, and that’s what should be optimized.
Here are the FID thresholds in ms:
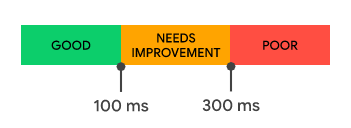
0 to 100 ms is a recommended value that proves the page is responding fast;
100 to 300 ms are acceptable, but should rather be optimized;
Over 300 ms — the page is responding slow, it must be optimized immediately.
How it works:
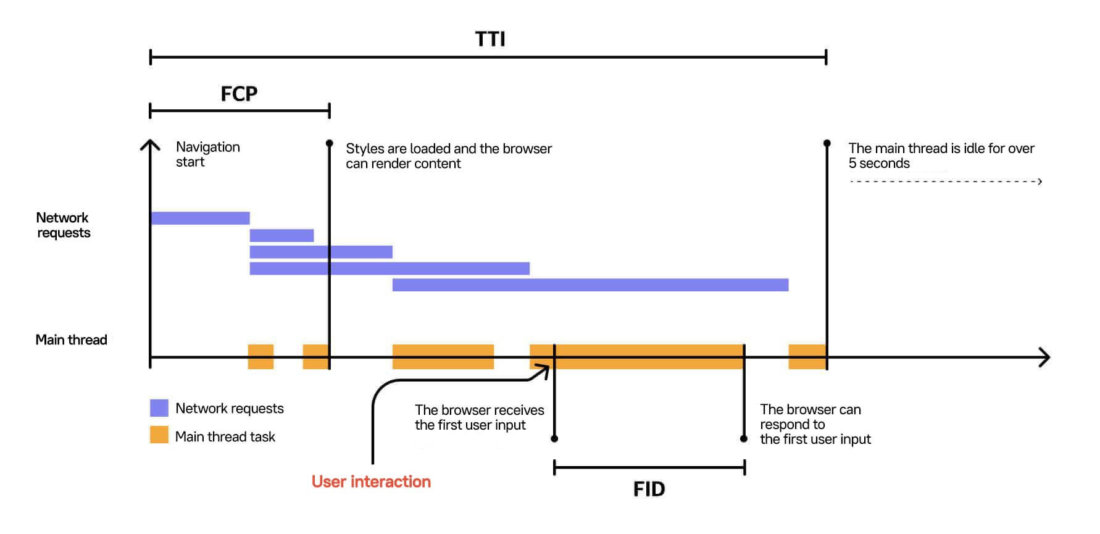
FCP means First Contentful Paint, not to be confused with LCP (Largest contentful paint).
TTI is Time to Interactive.
The blocks in purple are resource requests, most likely CSS and JS.
The blocks in yellow are periods when the browser’s main thread is busy for a while and can’t render a page.
In the above case, a user accidentally interacts with a page when the main thread just got busy (see the arrow). If a user interacted with a page a little earlier, when the browser was idle, it would be able to respond right away.
The input occurred when the browser was running a task. The browser should wait until the task is completed before it can respond to the input. That time is the FID for a user on the page.
FID can’t be measured with lab tools as the real-world user experience is required. However, there’s a similar metric that can be measured with lab tools — TBT (Total Blocking Time). This is the time required to complete a task in a thread exceeding 50 ms. Improvements in the TBT will positively impact the FID.
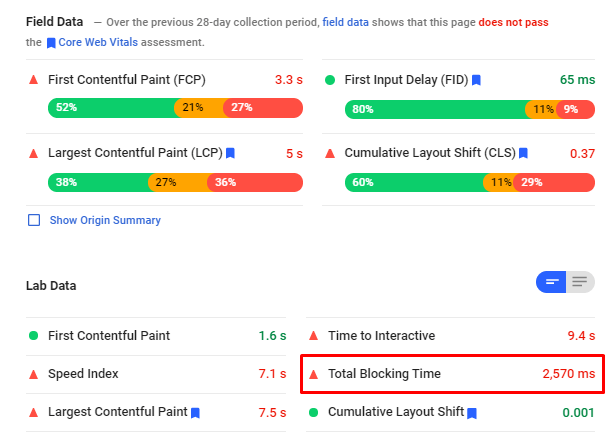
Measuring the FID
Field tools:
Search Console (Core Web Vitals report)
Improving the FID
- Load less JavaScript;
- Optimize long tasks;
- Postpone functionality you don’t need to render. Your major goal is to make the page interactive as soon as possible;
- Reduce the impact of third-party code;
- Minimize main thread: avoid complex layouts, reduce CSS, delete unused code.
What challenges are there?
- Most websites — 90% — have a high FID because users start interacting with pages when they are fully loaded;
- The FID doesn’t reflect the actual UX for the same reason;
- The FID may vary dramatically when running tasks.
- The lab TBT is a more representative metric, and you should care about it more.
3. Cumulative Layout Shift (CLS)
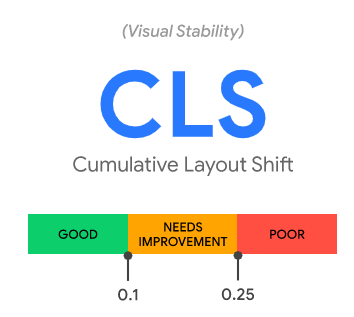
This is a user-centric metric for measuring visual stability. Elements may shift due to late image, font, or ad block loading.
These are the thresholds of the CLS values (shares):
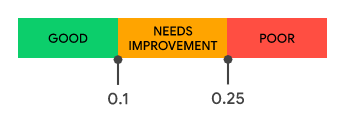
0 to 0.1 — elements don’t shift, and the page loads fine for a user.
0.1 to 0,25 — elements shift a little, you should optimize them.
0.25 and more — elements shift dramatically, you should optimize the page ASAP.
How it works:
How to measure this metric?
You can measure the CLS in the field or the lab.
Field tools:
Search Console (Core Web Vitals report)
Lab tools:
Improving the CLS
- Always specify the width and height of layout elements. It helps your browser freeze dimensions without shifting the layout.
- Secure some space for elements appearing after the main content loads: ad blocks, third-party widgets, postponed images, iframe.
- Use CSS instead of JS for animations, but be careful: don’t let your whole layout shift, don’t use transform: translate (all).
- Prefer CSS elements over JS.
- Make sure hovers and scrolls don’t shift the layout.
- Only use ad blocks and third-party widgets if you know their size. If you don’t, it’s likely to cause the CLS.
The layout shift often occurs due to conventional elements. That’s why fixing issues on one page can help you fix issues on other pages.
The CLS issues
1. They are evaluated throughout the session. If it lasts for 30 minutes, ALL shifts during this period are considered.
2. On single-page applications, shifts can be evaluated incorrectly.
3. The evaluation algorithm changes often.
Ok, so what should I do with these metrics?
Serge, an SEO guru at Dashly:
First of all, pay attention to Search Console recommendations in the “Core Web Vitals report” tab. You can see two separate reports for mobile and desktop websites.
Prioritize improvements on mobile. You’ll see in the report the average field data collected — this data collected during a month is considered for page ranking.
Look carefully at the “Poor” and “Needs improvement” recommendations. In every subreport, you’ll see a graph with the number of challenged pages and an example of a page with this or that issue. Besides, Search Console will group these pages by their guidelines. For instance, pages with articles will be grouped separately from landing pages or product listings.
Let’s talk about each metric in more detail:
- As for LCP, first, you should define the largest block. We use WebPageTest for that. There’s the Largest Contentful Paint report where you can see the largest piece of content. Often images or headlines are considered the largest blocks, and headlines’ fonts and images should rather be preloaded.
Remember to optimize images. They shouldn’t weigh too much and they should be in a modern extension.
- As for CLS, define which blocks “shift”. WebPageTest also provides the Cumulative Layout Shift report where you can see how your content shifts. If you have CLS issues, there’s a rather simple yet effective solution — just specify the Width and Height attributes of the blocks.
- The FID is probably the most complex metric. We suggest focusing on the TBT and running too long tasks, and splitting JS into smaller tasks.
If you’re expecting traffic from different countries or regions, set up a CDN for your website and blog.
Eugene, a webmaster, an SEO guru, improving PageSpeed scores for WordPress websites, says:
I think you don’t have to choose just one metric that is most important: LCP, CLS, or FID. I’m working on all of them. Now we see two sections in Search Console, “Core Web Vitals” and “Page Experience”. Sometimes I don’t even look at the scores in PageSpeed Insights as sometimes the test says my website scores 92 points, but the CLS is above the normal value. You should work on each metric separately, but remember they are all related to each other.
I would say website owners should begin with Search Console and see which metrics are red. These are actual user data collected in Google Chrome. Remember these are only average stats for the last 28 days. People forget that and expect improvements in Search Console the next day after they optimize their website.
Then, I’d suggest looking at the lab metrics in PageSpeed Insights and personal field ones in Lighthouse. You’ll see which metrics cause load delays. Sometimes you can just postpone counter loading or disable a script to get the improved values in a test.
You can significantly improve the LCP, CLS, or FID on a regular website powered by WordPress with these simple steps:
- Install any caching plugin (WP Super Cache, WP Fastest Cache, or any other — they all fit). The plugin will automatically specify the required rules in htaccess and enable caching in a browser. This will remove the “Set caching rules for static images” warning. Some hosting providers (like Beget) configure caching at the hosting level, so you can contact support and ask them to change the time of static files caching that is set up on Nginx.
- If you use analytics counters (Google Analytics, Liveinternet, Facebook Pixel, etc), install the True Lazy Analytics plugin.
- Remove unnecessary scripts using the WordPress Assets manager, dequeue scripts, dequeue styles plugin.
- If you have YouTube videos on your page, you can postpone loading using the Mihdan: Lite YouTube Embed plugin.
These simple steps should boost your website up to 80-90 points in PageSpeed Insights. Then, you can work on scripts and plugins, and layout styles.
Alexander, a SEO guru at Serpstat:
The first thing you should know is that good Core Web Vitals scores won’t get your website to the top. But they can help you maintain top positions thanks to page optimization. Alternatively, you can recover positions you lost due to the Dwell Time SEO parameter.
Pages can get bad behavioral scores and lower ranking due to bad rendering. If you work on the FID and CLS, you can improve the page rendering quality and decrease the Dwell Time value.
Those who get much traffic from Google Images should be careful about the LCP. It may seem reasonable to reduce the image size, but you may lose traffic after you optimize the image size. If you decide to work on this parameter, do it carefully.
Julia, Head of SEO at IT-Agency, says:
Improving user experience should be your never-ending priority because that will you’re your website grow. However, you shouldn’t strive to move from the red zone to the green one. Your goal is to gradually improve. If you went from the red zone to the yellow zone, you’re doing fine! If you progressed from the yellow zone to the green zone, you’re fabulous! Gradual improvements take time, and Google needs some statistically significant data to conclude you made some dramatic improvements. All metrics are calculated based on real traffic, this not just a tool measuring performance.
If we decompose performance by metrics, we’re likely to see this distribution:
- FID can be checked simply and clearly. The faster a page loads so users can interact with it, the better. We’re striving towards maximum possible acceleration.
- CLS is also simple and clear. It shows if your page is stable, whether the content “twitches” during loading. The fewer fluctuations, the better. Our goal here is zero shifts.
- LCP is a complex metric to check. It reports when a user sees the main content and considers the page usable. This metric depends on what users consider the main content. In this case, we’re striving to improve values in the long run.
Suppose you see that users click on the page elements, but nothing happens. It’s a sign that you should check if you have blocks interfering with their page experience.
Ruslan, Head of Business Development of the “Otrazhenie” clinic (its mobile website scored 97 points, and desktop version scored 100 points in PageSpeed Insights), says:
Let’s just wait for a little until Google sorts things out. They normally say that they collect all statistics from user devices. After you optimized something, don’t expect to see the results right away; check your metrics in one or two months. We had to wait for some time despite that we optimized all metrics after tests. The report in Search Console took two months to improve.
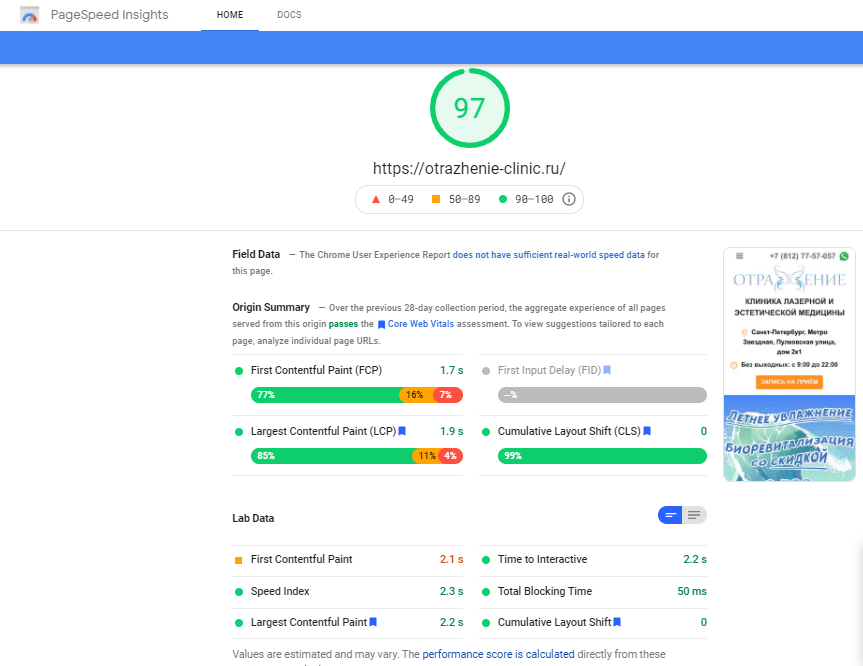
The score of the “Otrazhenie” clinic’s mobile website in PageSpeed Insights
Read also:
The Benefits of Sales Funnel Reporting for SaaS Companies
How to Automate Your Sales Funnel for Higher Lead Quality
How does a live chat impact loading speed?
The longer it takes for a page to load and the worse the ranking, the worse the business metrics: traffic, leads, and eventually sales. Additional software installed on a website may slow it down. We are doing our best not to allow that on our customers’ websites, and we optimize the script of our live chat with every update.
Last year, we did lab research to identify the impact of our live chat, Chatra, Helpcrunch, Intercom, and Drift on a website. The research outcomes say Dashly’s live chat impacted the page loading speed the least. Live chats from Usedesk and Intercom scored good grades, too. Live chats from User.com, Livechat, Chatra, Drift decreased loading speed by 10-30 points. As for live chats from Convead, and Helpcrunch, they reduced website scores by 30-50 points.
We’ll keep an eye on how these updates impact website ranking and keep you posted.


![Growth Marketing, o que é? O guia definitivo [explicado por um hacker de crescimento]](https://www.dashly.io/blog/wp-content/uploads/2023/04/The-ultimate-guide-to-growth-marketing-explained-by-a-growth-hacker-720x317.png)
