Enhance Sales Funnel Reporting: 3 Reports Examples + Expert Tips

Spent months crafting the perfect sales funnel, fine-tuning every stage, and driving leads through each step like a champ. But when it comes to reporting? It’s like reading a novel with half the pages missing. This is where most companies stumble — sales funnel reporting often feels like a maze with no clear end, leaving teams unsure of where conversions dip or why leads fall off.
At Dashly.io, we’ve seen it all: clients with stacks of data but no clarity on what it means, reports filled with vanity metrics that do nothing for conversions, and missed opportunities just because they couldn’t track what’s working. But the right report doesn’t just organize data — it’s a roadmap to doubling your leads.
In this article, we’ll explain the essentials of building a sales funnel report that guides you to results. Plus, we’ll dive into the top 3 sales funnel reports every business needs to see where their funnel stands, what’s holding them back, and how to fix it for actual conversions.
What is a sales funnel report?
A sales funnel report is a powerful tool that lets you see how effectively you’re moving leads through each stage of your funnel. It breaks down each step, showing where leads convert or drop off, giving you a clear view of your pipeline’s performance.
By analyzing these stages, funnel reports allow you to analyze the conversion rates between stages, highlighting potential bottlenecks and opportunities to optimize for more conversions.
Here’s what a typical sales funnel report includes:
- Lead Stages: Shows each phase of the funnel — from awareness to decision — and tracks leads as they progress.
- Conversion Rates: Calculates the percentage of leads that move from one stage to the next, helping you spot where they’re getting stuck.
- Drop-Off Points: Highlights stages where leads are leaving the funnel, indicating areas that need improvement.
- Time Spent per Stage: Measures how long leads stay in each stage, revealing potential delays or friction points.
- Performance Insights: Provides insights into how your sales pipeline is performing overall, giving you actionable data to adjust your strategy.
With a clear sales funnel report, you can spot exactly where to make changes and drive more leads to conversion.
Benefits of using a correct report for a sales funnel
Using the right sales funnel report is a game-changer — it gives you the data needed to turn leads into sales instead of leaving conversions to chance. Over at Dashly.io, we’ve worked with countless clients who doubled their pipeline results by optimizing each stage based on solid insights. A well-designed report is like having a roadmap that pinpoints what’s working and where things are going off course.
Here’s why a clear and actionable sales funnel report is worth it:
- Identifies Conversion Roadblocks: An excellent report reveals where leads drop off, helping you fix weak points and smooth the journey so fewer leads go to waste.
- Improves Sales Efficiency: With precise data on where your team should focus, you avoid wasting time on leads that aren’t ready. You’ll know which stages need more nurturing and which are primed for a push.
- Optimizes Resource Allocation: Knowing which funnel stages drive the most conversions lets you allocate resources — whether it’s budget, time, or team effort — exactly where they’ll make the biggest impact.
- Boosts Conversion Rates: With insights on what persuades leads to move forward, you can tweak each stage to better match your prospects’ needs, ultimately improving your funnel’s conversion rates.
- Tracks Lead Quality: A quality funnel report helps separate high-potential leads from less engaged ones, so you can focus your efforts on leads most likely to close.
- Helps Forecast Sales Growth: By tracking patterns in your funnel, you get a realistic view of future sales. This makes planning and goal-setting more accurate.
When used right, these reports don’t just track numbers — they help you turn more leads into actual sales, taking your pipeline from “okay” to “unstoppable.”
Top 3 sales funnel reports examples
here are the top three sales funnel reports we recommend to give you a complete view of your pipeline performance and help you double down on what works.
1. Conversion-focused report
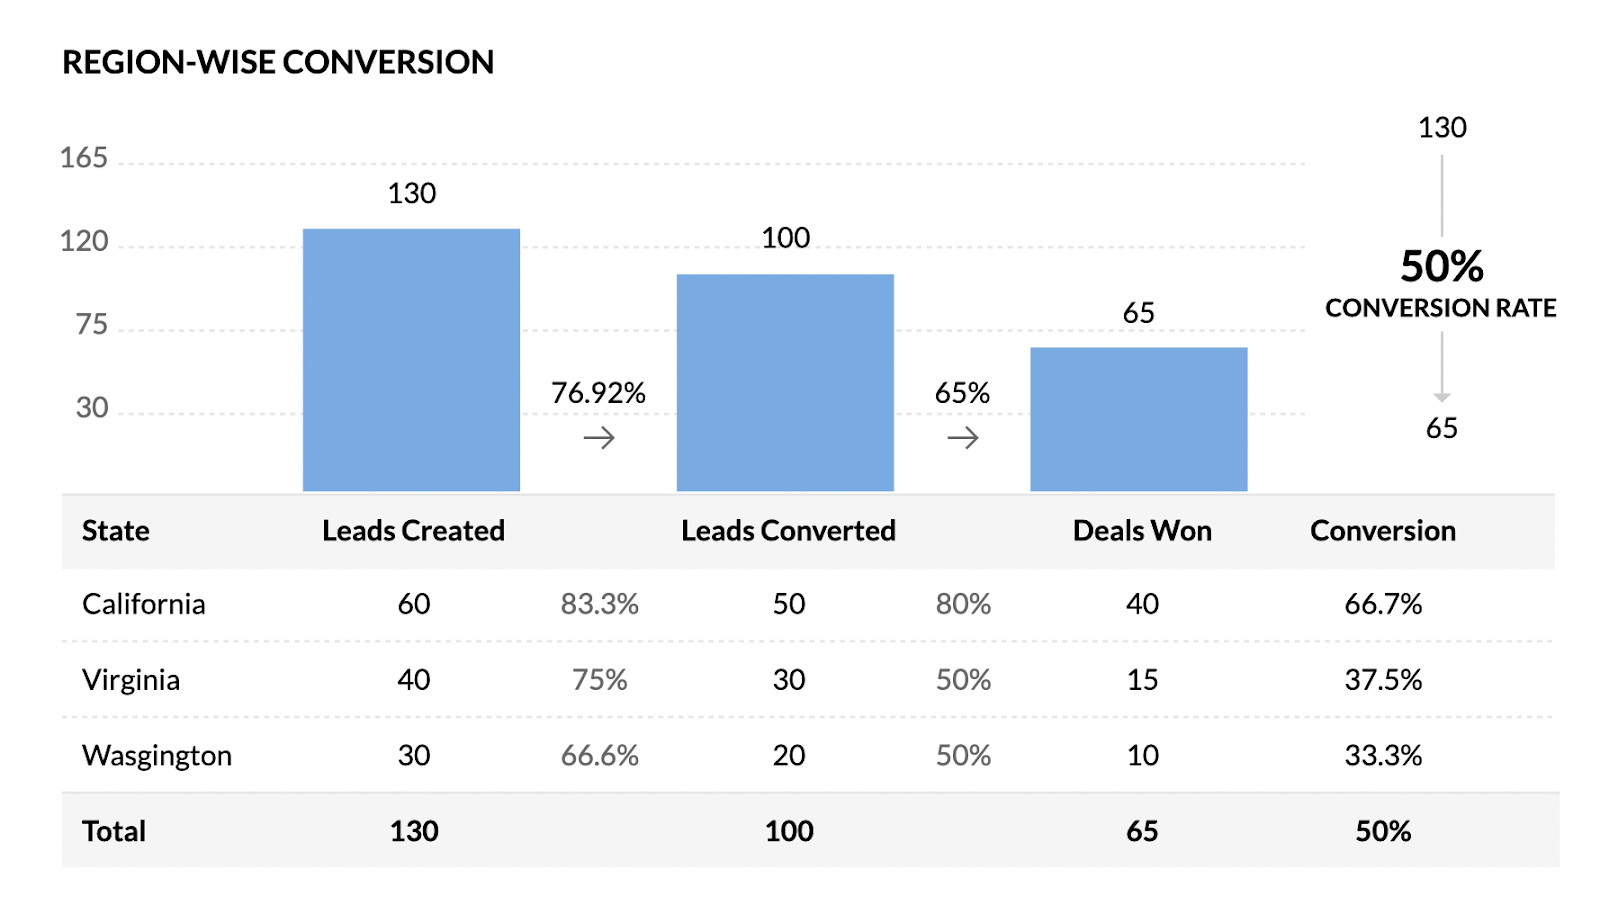
A conversion-focused sales funnel report helps you zero in on each stage of the funnel, tracking conversions and drop-offs to reveal precisely where leads are moving forward and where they’re slipping through the cracks. This type of report, as shown in Zoho’s visual, breaks down the entire funnel from start to finish, giving you actionable insights on each phase.

Key Elements:
- Funnel Stages: Defines each stage of the sales journey, from initial contact to closing.
- Conversion Rates: Tracks the percentage of leads converting at each stage, highlighting performance gaps.
- Lead Drop-Off Points: Indicates exactly where leads exit the funnel, helping you focus on areas that need immediate improvement.
- Visual Breakdown: Presents data in a clear, visually segmented funnel, making it easy to spot stages with the highest opportunities and conversions.
Why It Works:
This report style is ideal for teams aiming to boost conversions at each stage of the funnel. It provides a high-level overview while showing granular details, helping you target and optimize the exact phases where leads convert the most. With this insight, you can adjust strategies and improve conversions, knowing which stages need attention.
2. Revenue-Focused Funnel Report
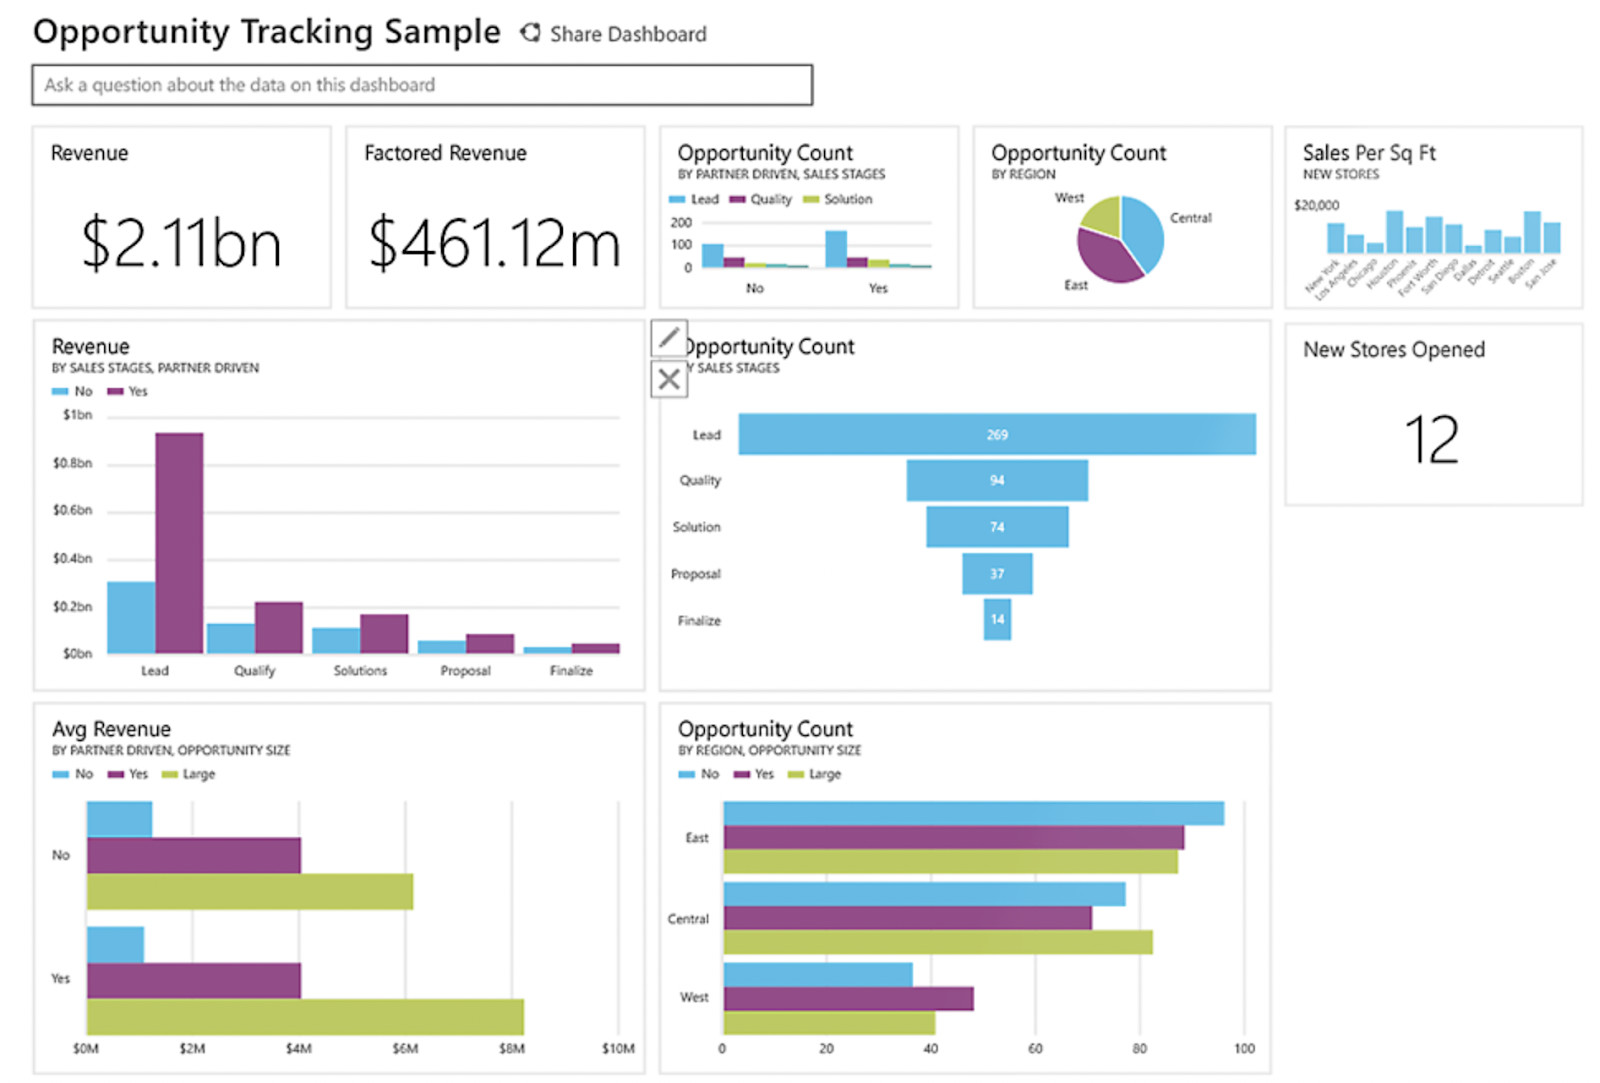
It’s not just about leads — it’s about revenue. This report, similar to one by Gary Smith, combines lead counts with revenue data to show how much each stage contributes to your bottom line.

Key Elements: Total revenue per stage, stages, close dates.
Why It Works: By highlighting revenue at each stage, this report enables more accurate financial projections and lets you focus efforts on high-revenue stages, ensuring you’re not just filling the funnel but maximizing its value.
3. Funnel Leakage Report
Leakage can drain your funnel before leads get anywhere near a sale. A leakage report, like the one from Trump Excel, pinpoints exactly where leads are falling out, so you know where to plug the holes.

Key Elements: Funnel stages, revenue per stage, percentage of leads lost at each stage.
Why It Works: This report is critical if you notice a significant drop-off at certain points. It provides a clear, stage-by-stage view of where leads slip away, helping you focus on the stages that need immediate attention.
Choosing the right sales funnel report depends on your goals and current challenges within the funnel. Are you trying to understand lead distribution, forecast revenue, or stop lead leakage? Each report offers unique insights, so match your choice to the specific areas you want to improve.
- Visual Overview of Funnel Phases and Opportunities: Ideal if you’re just starting out with tracking and want a simple view of lead stages and opportunities.
- Revenue-Focused Funnel Report: Best if your priority is understanding revenue flow at each stage and improving financial projections.
- Funnel Leakage Report: Essential when you’re struggling with significant drop-offs in your funnel, as it highlights exactly where and how much leakage occurs.
At Dashly.io, we’ve seen that selecting the right report based on your funnel’s needs is key to doubling down on effective strategies and converting more leads.
How to build your own sales funnel report
Building a sales funnel report can seem tricky, but it’s straightforward when you break it down. At Dashly.io, we’ve helped clients double their leads by using clear, focused funnel reports. Here’s a simple guide to creating one that’ll give you the insights you need.
- Define Your Funnel Stages: Identify each stage in your sales funnel. Common stages include Awareness, Interest, Decision, and Conversion, but these can vary depending on your process. Clear stages help you see exactly where each lead is in the journey.
- Collect Key Metrics: Track essential data at each stage, including:
- Lead Count: Total leads entering each stage.
- Conversion Rate: Percentage of leads moving from one stage to the next.
- Drop-Off Rate: Number of leads exiting the funnel at each stage.
- Visualize the Data: Display these metrics using charts or graphs. This will help you see where your funnel is strongest and where you lose leads.
- Analyze Revenue Impact: Don’t just track leads — monitor revenue tied to each stage. Knowing where income is highest or lowest lets you focus efforts where they count.
- Set Up Regular Reporting: Include your sales funnel report in a regular review cycle. Weekly or monthly updates help you monitor trends and react quickly to dips in performance.
Dashly best practices for sales funnel reporting
Here are some advanced best practices to ensure your reporting drives actionable insights.
- Segment Your Leads: Don’t just track total leads; segment by source, demographic, or behavior. This allows you to see which leads are converting and which might need a different approach, giving you deeper insight into funnel performance.
- Use Goal Tracking: Set clear goals for each stage. Whether it’s an engagement target or a conversion rate, having benchmarks allows you to measure success more accurately and keep the team aligned on priorities.
- Incorporate Lead Scoring: Assign scores based on actions (e.g., signing up for a demo, viewing pricing pages). This helps identify high-quality leads moving through the funnel, making it easier to prioritize follow-ups and personalize outreach.
- Monitor Trends Over Time: Rather than only looking at one-off metrics, examine trends over weeks or months. This helps you spot seasonal shifts or the impact of specific campaigns, revealing long-term patterns.
- Automate Where Possible: Use tools to automate data collection and reporting. This saves time and reduces human error, ensuring you have accurate, up-to-date information.
- Regularly Test Funnel Adjustments: Continuously experiment with changes to your funnel based on report data. Whether tweaking messaging or adjusting follow-ups, testing lets you refine each stage for maximum impact.
By applying these practices, you’ll turn your sales funnel report into a dynamic tool that doesn’t just track performance — it actively guides your team’s strategy for better, faster conversions.
The best tools for your sales reports
When it comes to optimizing your sales funnel and effectively tracking leads, having the right reporting tools is crucial. At Dashly.io, we’ve seen clients double their sales leads by leveraging robust reporting platforms. Here are three top tools to consider:
1. HubSpot Sales Hub
HubSpot Sales Hub offers comprehensive reporting features that provide deep insights into your sales funnel. Its customizable dashboards allow you to monitor lead progression and conversion rates and identify real-time bottlenecks.

The platform’s AI-powered tools also assist in generating detailed sales reports, enabling data-driven decision-making.
Price

HubSpot Sales Hub offers a free version with basic features. Paid plans start at $100 per month, scaling up based on additional features and team size.
2. Microsoft Power BI
Microsoft Power BI is a business analytics service that provides interactive visualizations and sales reports. It lets you connect to various data sources, transforming raw data into insightful sales funnel analyses.

With its robust data modeling capabilities, you can create detailed reports that track lead performance across different stages of the funnel.
Price

Power BI offers a free version with limited features. The Pro version is priced at $9.99 per user per month, with additional costs for premium features.
3. Looker Studio
Formerly known as Google Data Studio, Looker Studio is an online tool for converting data into customizable, informative sales reports and dashboards. It allows you to create reports from scratch or use templates, connecting with various data sources to provide real-time insights into your sales funnel. Its interactive dashboards help visualize lead progression and identify areas for improvement.

Price: Looker Studio is free, with a Pro version offering additional features at a cost.
Read also: TOP 15 best sales funnel software to grow the number of deals closed
FAQ
A complete sales funnel report typically includes:
– Funnel stages and definitions
– Number of leads at each stage
– Conversion rates between stages
– Drop-off rates
– Revenue data (if applicable)
A weekly or monthly review is ideal for monitoring trends and making timely adjustments. Regular updates help you spot early signs of issues or opportunities in your funnel.
Bottlenecks are stages with lower-than-expected conversion rates or high drop-off rates. By examining these stages, you can identify areas where leads struggle to progress and make targeted improvements.
Popular tools for sales funnel reporting include HubSpot Sales Hub, Microsoft Power BI, and Looker Studio. Each provides visualization and reporting capabilities that help you analyze your funnel and gain actionable insights.


![The ultimate guide to growth marketing in 2025 [explained by a growth hacker]](https://www.dashly.io/blog/wp-content/uploads/2023/04/The-ultimate-guide-to-growth-marketing-explained-by-a-growth-hacker-720x317.png)
![10-step Guide on How to Create a Chatbot for your Website [Build without code]](https://www.dashly.io/blog/wp-content/uploads/2022/06/How-to-create-a-chatbot-to-automate-conversations-with-your-website-visitors-720x317.png)

![Top 10 Best Custom Chatbot Platforms for your website [+AI]](https://www.dashly.io/blog/wp-content/uploads/2020/06/cover-1-720x308.jpg)
